
Changelog

New updates and improvements released to Codspeed.

Changelog

Jan 20, 2026

Launch Week #2

Find CPU and Memory Bottlenecks with Performance Counters
Find CPU and Memory Bottlenecks with Performance Counters

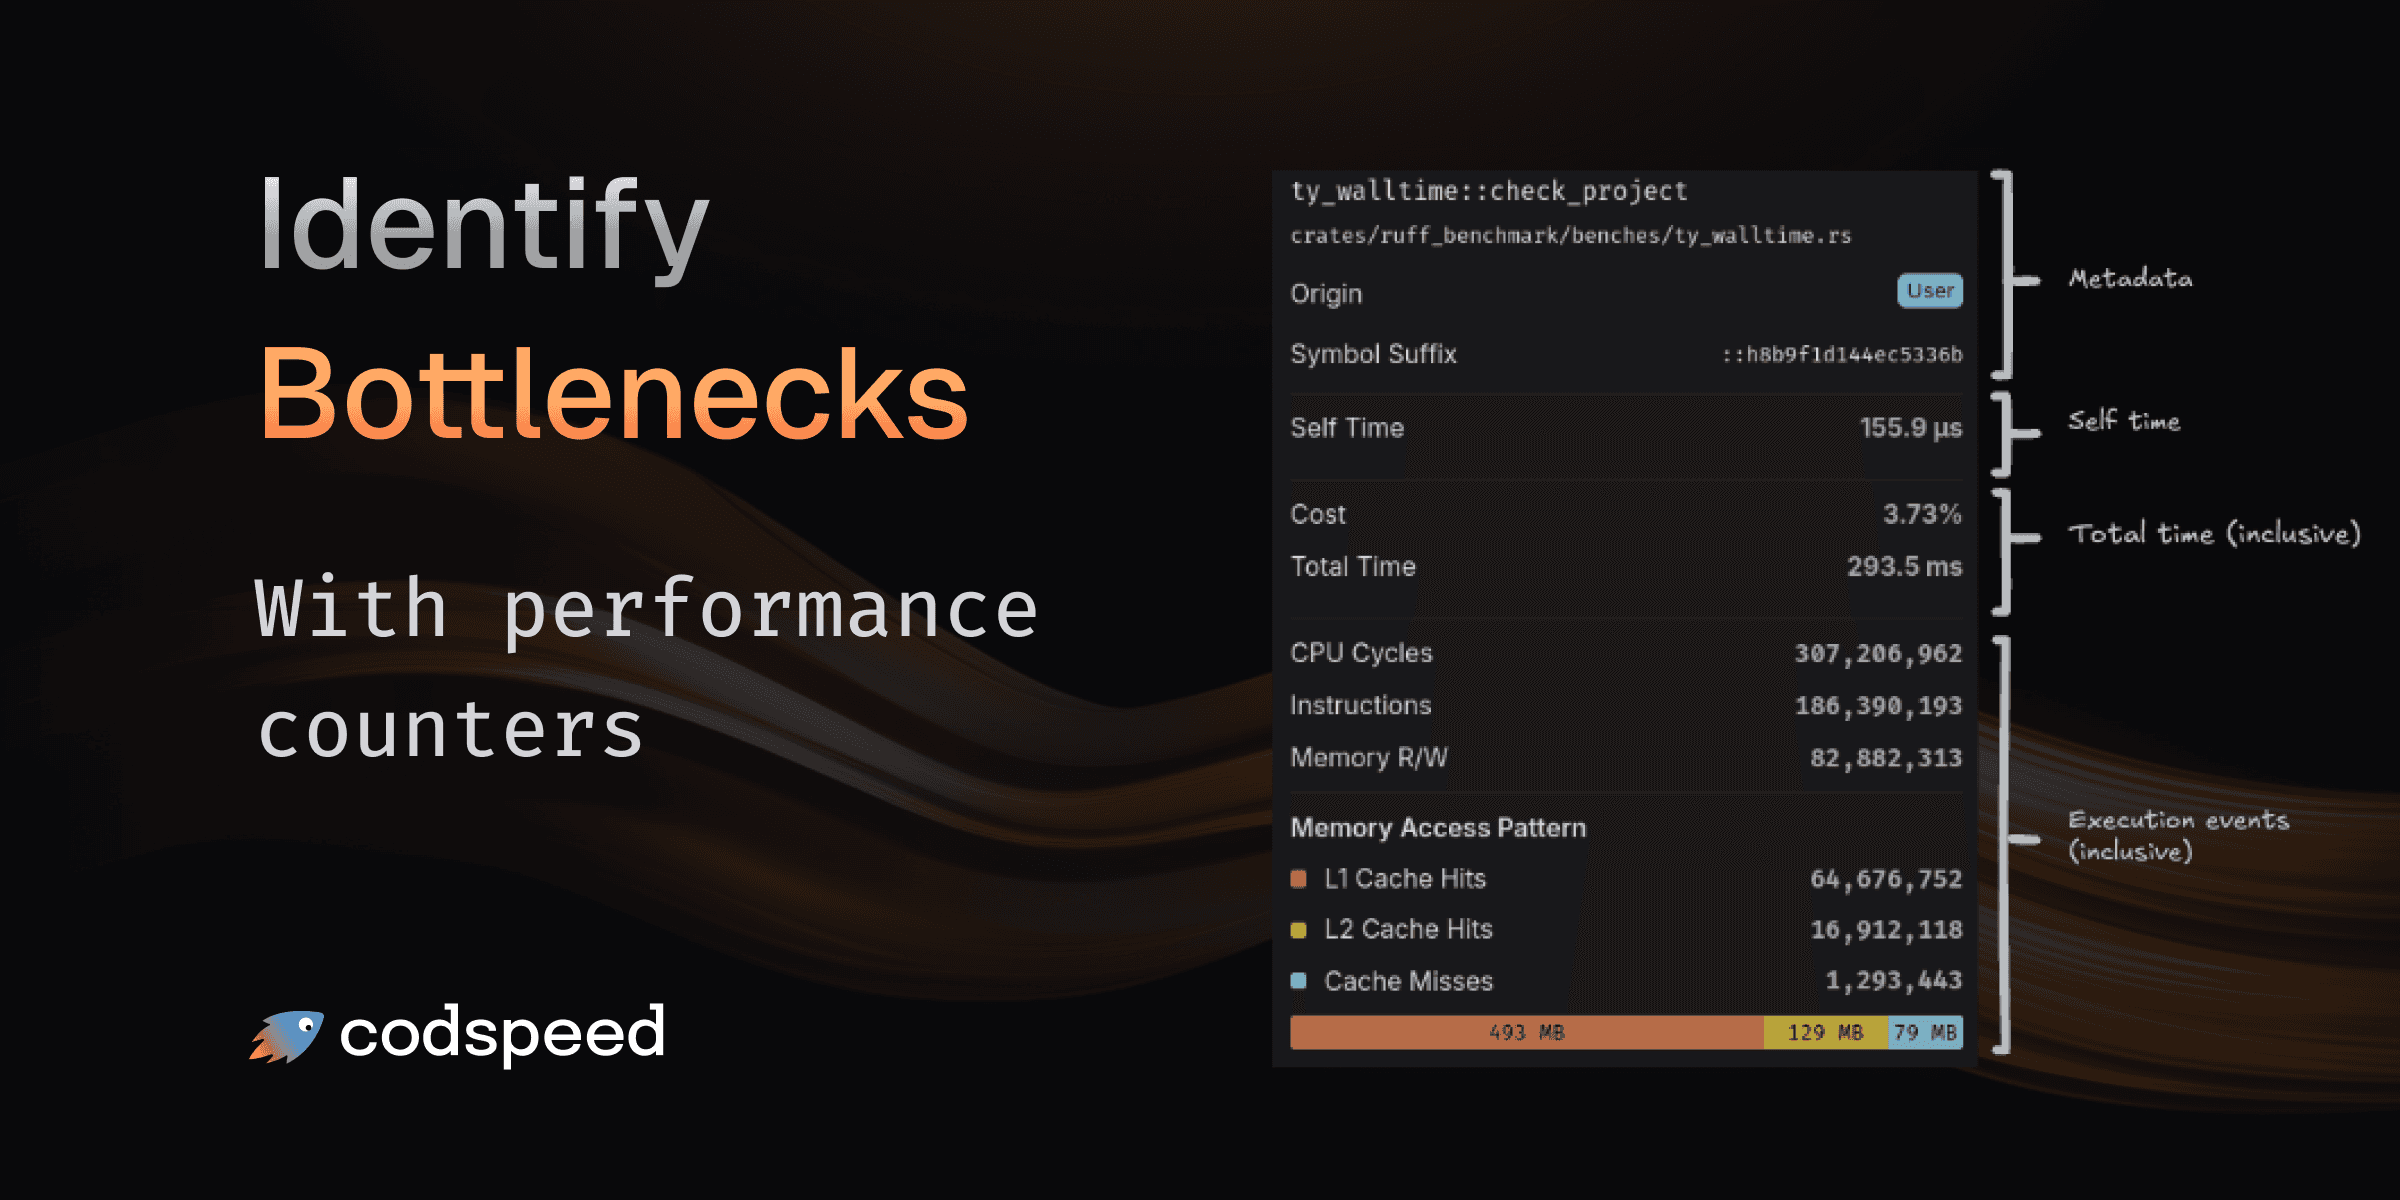
Understanding that your code is slow is one thing. Understanding why it's slow is what lets you fix it. Walltime profiling now automatically collects hardware performance counters during execution, giving you deep insights into CPU cycles, instruction counts, memory operations, and cache behavior.

Performance counters showing cache behavior and memory traffic

What You Get

Every walltime profile now includes comprehensive hardware metrics that help you pinpoint performance bottlenecks:

Performance counters explanation

Example of performance counters in the tooltip

CPU Metrics

  • CPU Cycles: Total number of CPU cycles elapsed during execution
  • Instructions: Number of CPU instructions executed

Memory Metrics

  • Memory R/W: Total memory read and write operations performed

Memory Access Pattern

See exactly how your memory accesses are served with a detailed breakdown:

  • L1 Cache Hits: Fastest memory accesses served from L1 cache
  • L2 Cache Hits: Accesses served from second-level cache
  • Cache Misses: Expensive accesses requiring main memory fetch
  • Memory Access Distribution: Total bytes transferred at each cache level, calculated based on access patterns and cache line sizes

Finding the Bottleneck

The visual memory access pattern gauge shows at a glance where your code spends its time:

  • High L1 cache hit rate? Your data access patterns are efficient.
  • Lots of cache misses? Consider restructuring data layouts or reducing memory footprint.
  • Large memory access distribution across all levels? Your working set may be too large for cache, consider processing data in smaller chunks.

Combined with the flame graph, you can now trace performance issues from high-level function calls down to specific memory access patterns causing slowdowns.

Available Now

Performance counters are automatically collected when running benchmarks on CodSpeed Macro Runners with walltime profiling enabled.

Learn more about Walltime Profiling.
Read more

Jan 19, 2026

Launch Week #2

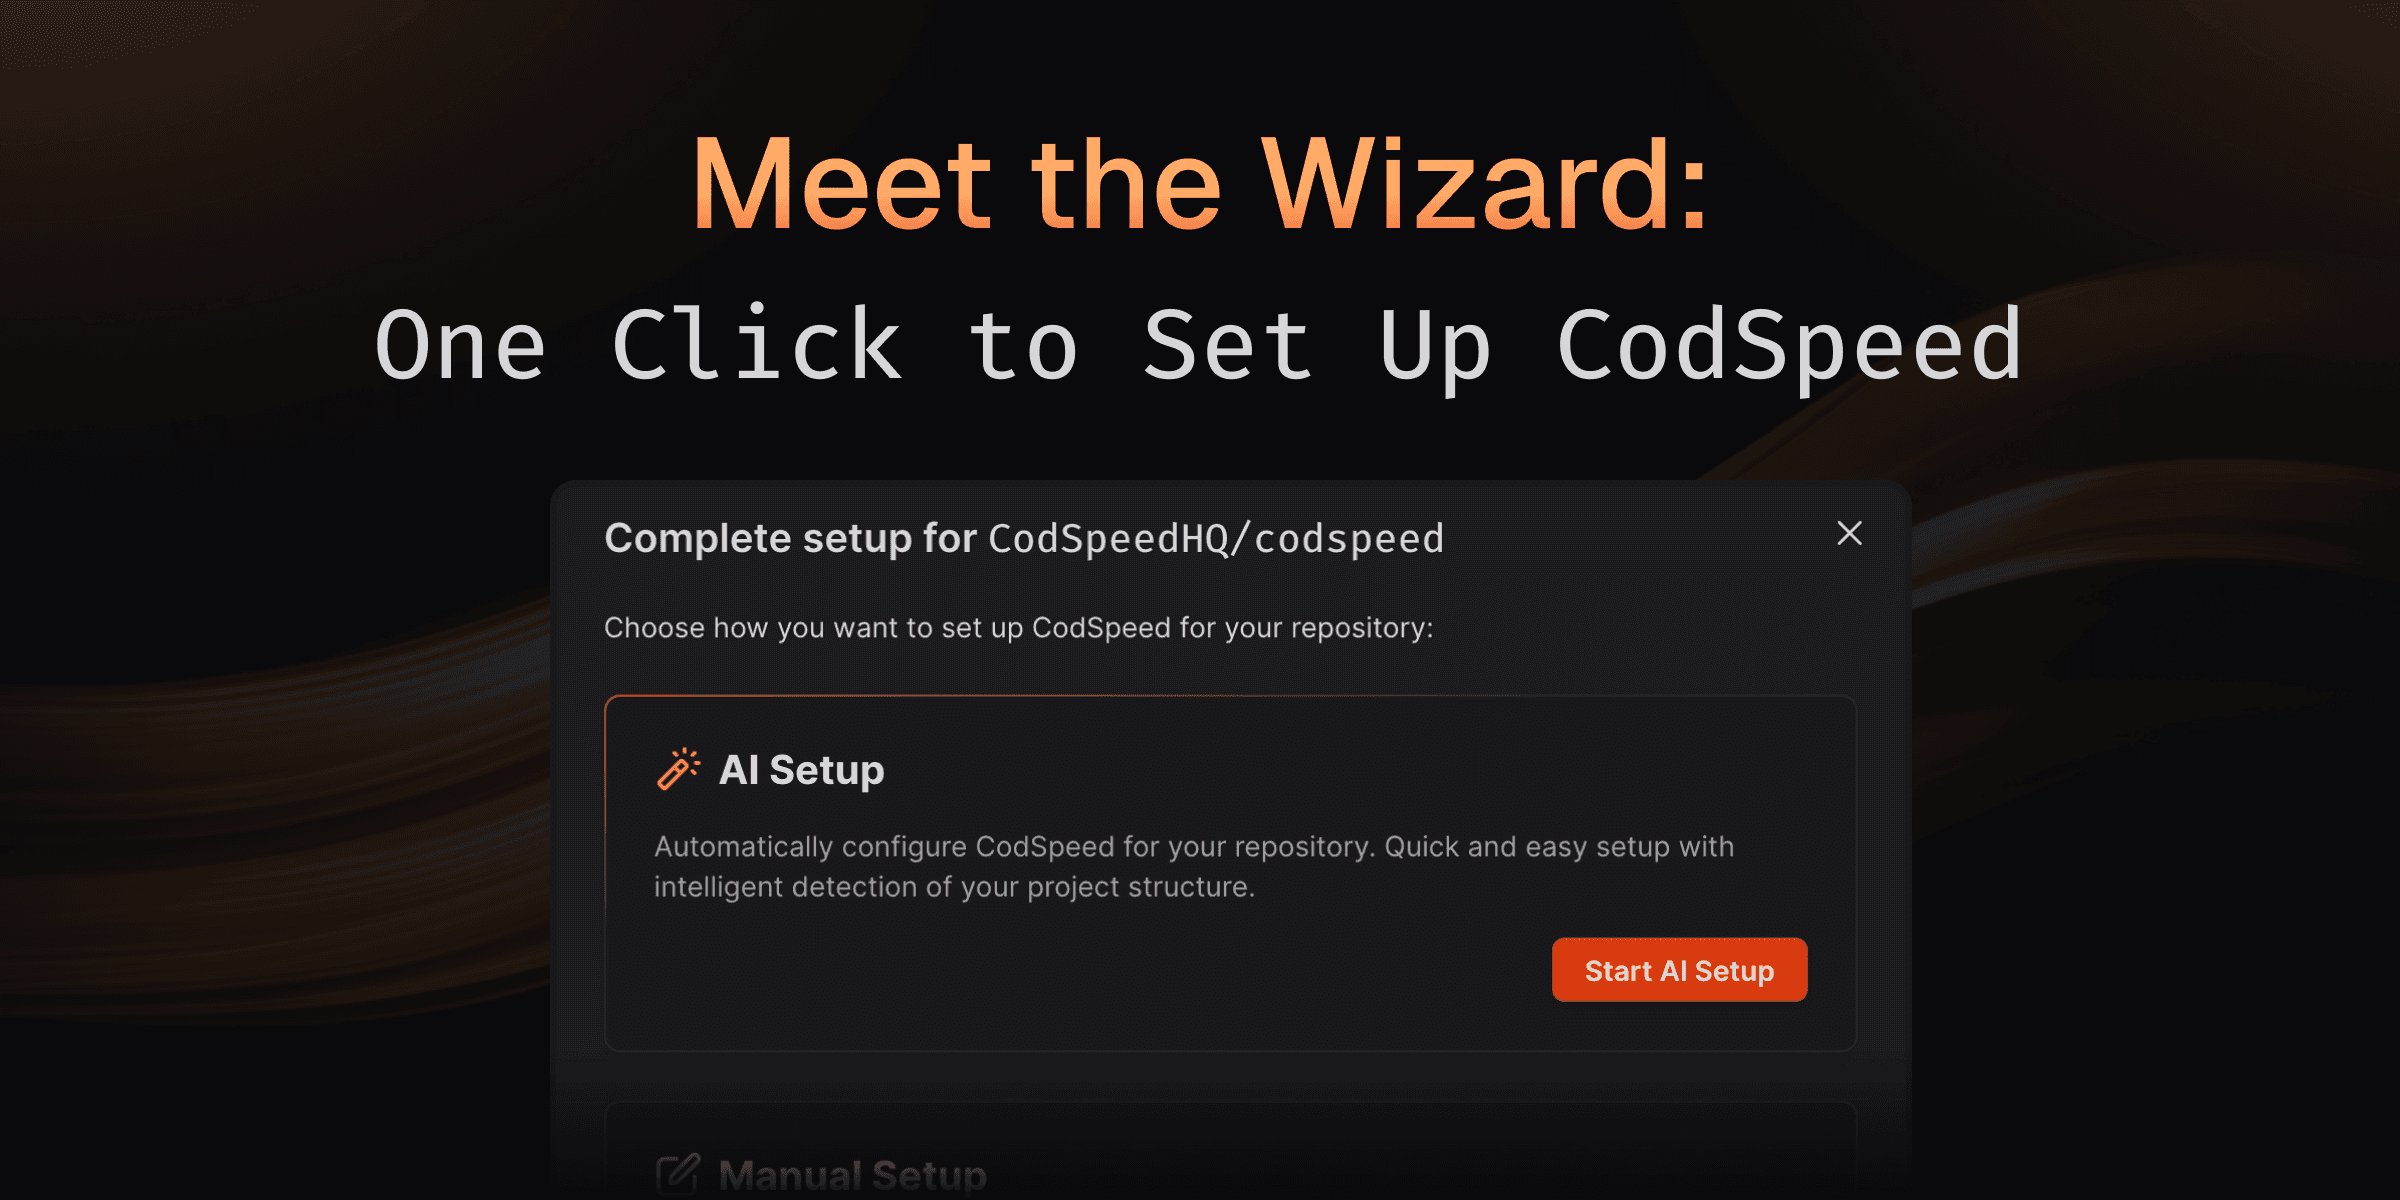
Meet the Wizard: One Click to Set Up CodSpeed

Meet the Wizard: One Click to Set Up CodSpeed

Setting up continuous performance checks shouldn't take hours of reading docs, configuring workflows, and hoping you got everything right.

With the CodSpeed Wizard, our agent handles it all in one click. Detecting your project structure, hooking up benchmarks to the CodSpeed Harness, and generating optimized CI workflows.

Watch the Wizard set up a repository (dtolnay/anyhow) from scratch

How It Works

The Wizard analyzes your repository and handles the entire setup process:

  1. Detects existing benchmarks: Automatically finds and configures your benchmarks in the language and framework you're using.
  2. Creates benchmarks if needed: No benchmarks yet? The Wizard generates appropriate benchmark files for your project
  3. Generates CI workflows: Creates optimized GitHub Actions or GitLab CI configurations tailored to your setup
  4. Opens a pull request: All changes are submitted as a PR for you to review and merge

The entire process takes minutes instead of hours, and you can review every change before merging.

Codebase Integration

The Wizard doesn't just template files—it understands your project:

  • Detects your testing framework and build system
  • Identifies the right directories for benchmark files
  • Configures appropriate runner settings based on your needs
  • Ensures compatibility with your existing CI pipeline

Whether you're adding CodSpeed to a mature project with established benchmarks or starting fresh, the Wizard adapts to your workflow.

What's Coming Next?

The Wizard is just getting started. We're working on even more powerful capabilities:

  • On-demand benchmarks: Add new benchmarks for specific functions or modules directly from your dashboard
  • GitHub-native performance fixes: Comment on performance regressions in pull requests and let the Wizard automatically investigate and propose optimizations
  • Continuous optimization: Proactive suggestions for benchmark coverage and performance improvements as your codebase evolves

The future of performance monitoring is automated, intelligent, and seamlessly integrated into your workflow.

Try It Yourself in One Click

From your CodSpeed dashboard, click "Configure repository" and then "Start AI Setup" to let the Wizard do the work. You'll have a pull request ready for review in minutes, complete with all the configuration needed to start tracking performance.

Ready to automate your setup? Head to your dashboard and try it out.

Read more

Nov 19, 2025

Simpler Authentication with OIDC

Simpler Authentication with OIDC

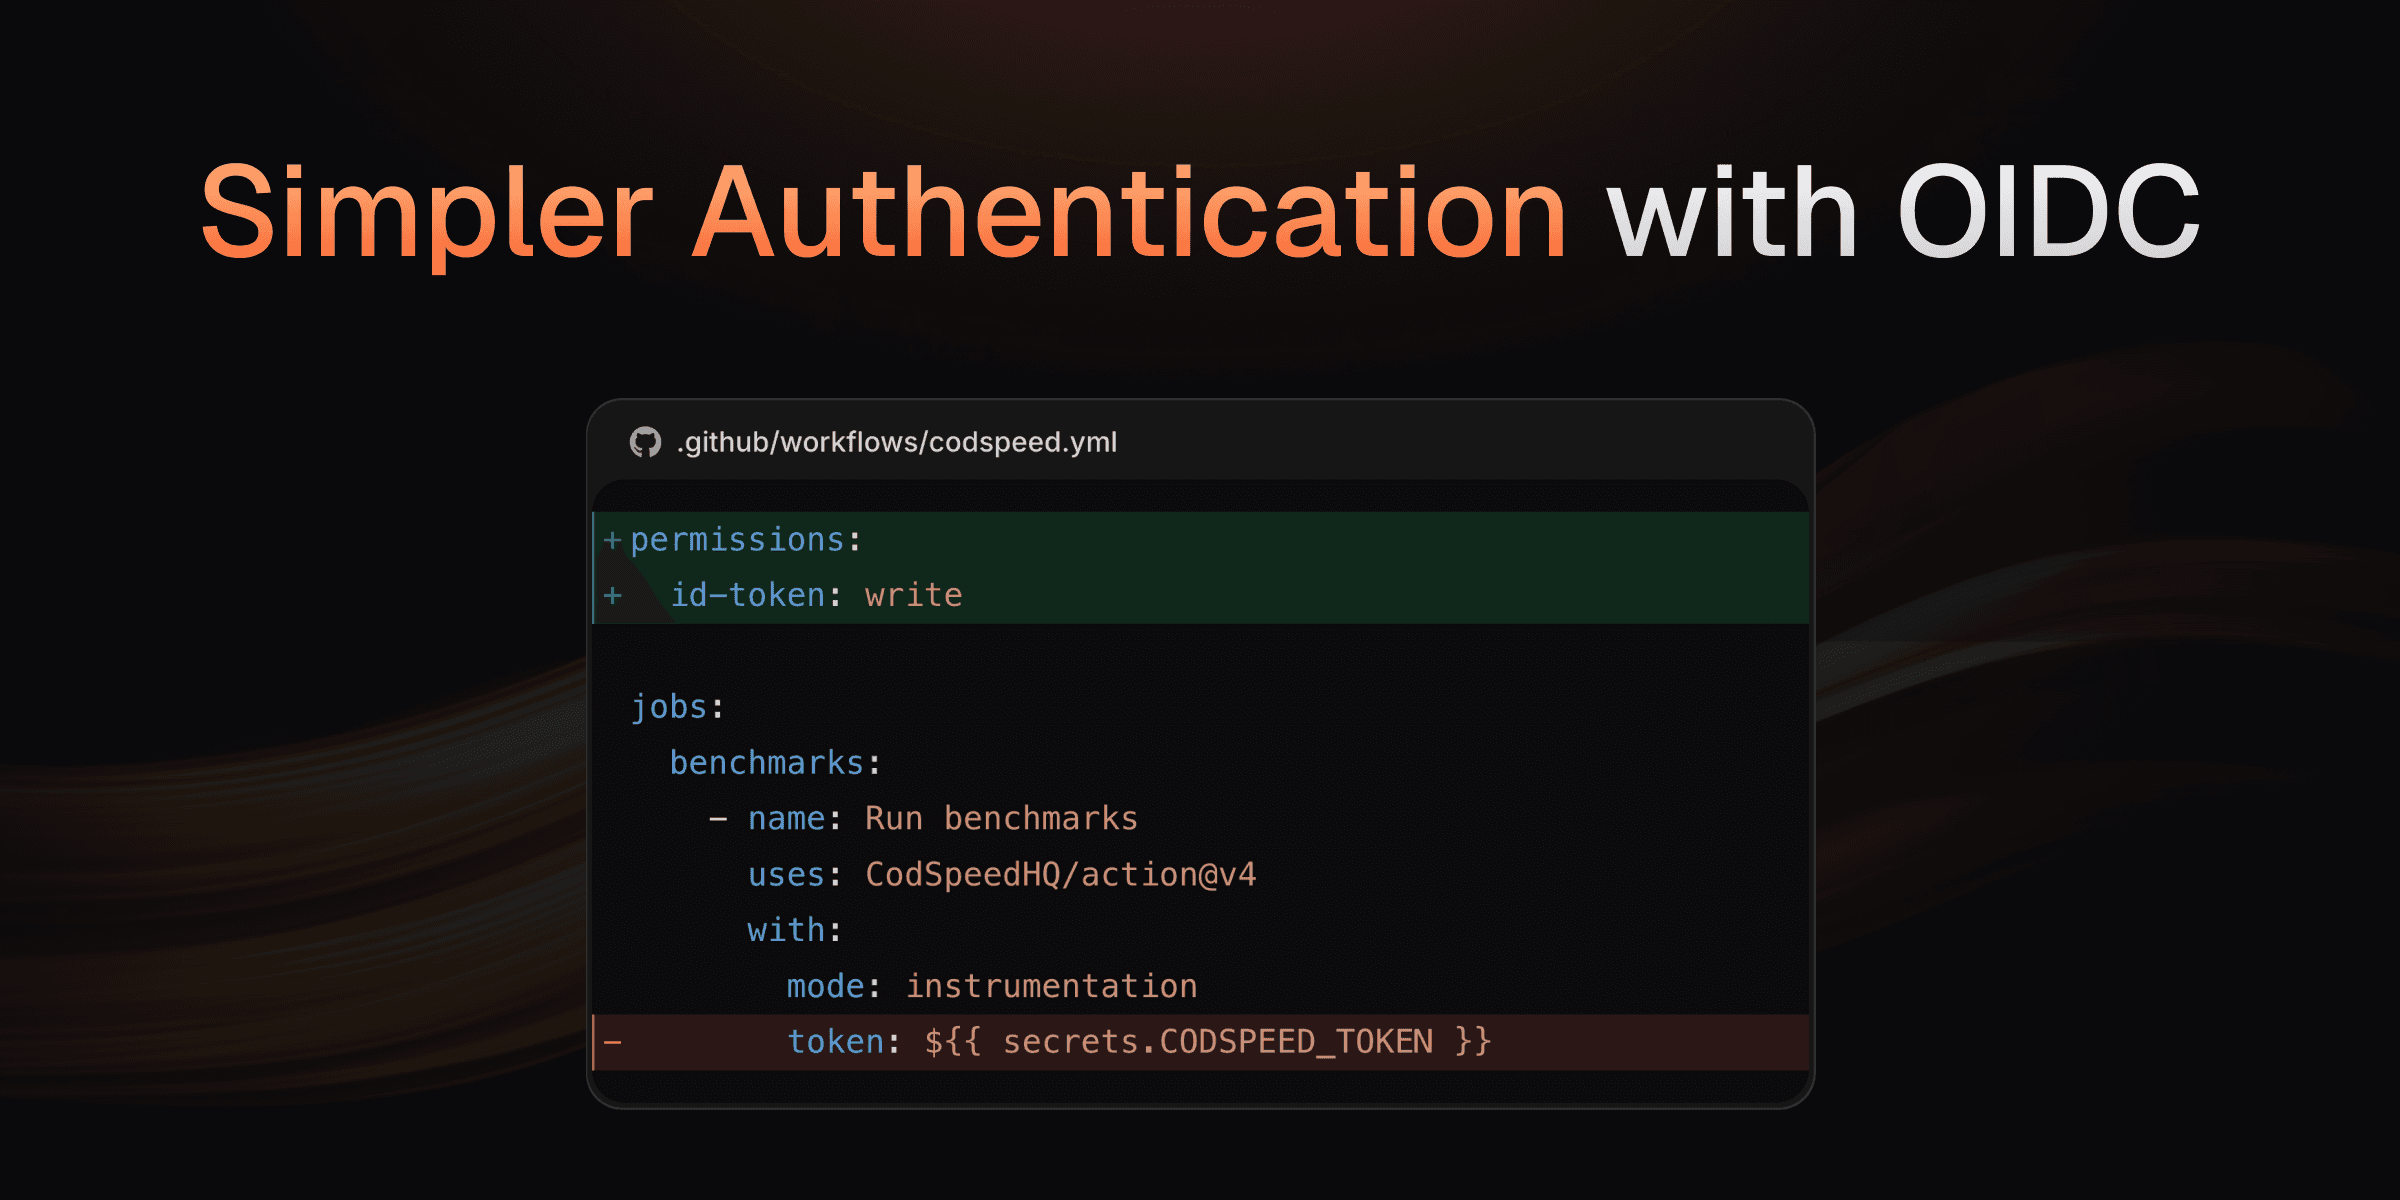
You can now authenticate your CI workflows using OpenID Connect (OIDC) tokens instead of CODSPEED_TOKEN secrets. This makes integrating and authenticating jobs safer and simpler. OIDC uses short-lived tokens automatically generated by your CI provider (GitHub Actions or GitLab CI). These tokens are cryptographically signed and verified, eliminating the need to manage long-lived secrets.

Backward compatible: Existing workflows using CODSPEED_TOKEN, or public repositories without a token will continue to work without any changes.

How to migrate

GitHub Actions

To use OIDC authentication in GitHub Actions:

  • Add the required permissions to your workflow file.
  • Remove the token input from the CodSpeed action step.

Here's an example of migrating a GitHub Actions workflow:

name: Benchmarks

on:
  push:
    branches: [main]
  pull_request:

jobs:
  benchmarks:
    runs-on: ubuntu-latest
    permissions:
      contents: read # required for actions/checkout
      id-token: write # required for OIDC authentication with CodSpeed
    steps:
      - uses: actions/checkout@v4
      - uses: actions/setup-node@v4
      - ... # other setup steps
      - name: Run Benchmarks
        uses: CodSpeedHQ/action@v4
        with:
          run: npm run bench
          mode: instrumentation
          token: ${{ secrets.CODSPEED_TOKEN }}

For public repository forks where OIDC tokens aren't available, CodSpeed automatically falls back to the existing tokenless validation process.

Learn more in our GitHub Actions documentation.

GitLab CI

To use OIDC authentication in GitLab CI:

  • Add the CODSPEED_TOKEN variable as an OIDC token in your job configuration.
  • Remove the CODSPEED_TOKEN secret from your project settings.

Here's an example of migrating a GitLab CI workflow:

workflow:
  rules:
    - if: $CI_PIPELINE_SOURCE == 'merge_request_event'
    - if: $CI_COMMIT_BRANCH == $CI_DEFAULT_BRANCH
codspeed:
  id_tokens:
    CODSPEED_TOKEN:
      aud: codspeed.io
  stage: test
  image: python:3.12
  before_script:
    - pip install -r requirements.txt
    - curl -fsSL https://codspeed.io/install.sh | bash
    - source $HOME/.cargo/env
  script:
    - codspeed run --mode instrumentation -- pytest tests/ --codspeed

Learn more in our GitLab CI documentation.

Read more

Oct 31, 2025

Finer Change Detection with Custom Benchmark Thresholds

Different benchmarks have different performance characteristics. For example, benchmarks with I/O operations or multi-processing can vary more between runs. These kind of variability is inherent to the benchmark, no matter how we measure it. A single global regression threshold treats all benchmarks the same, which means either accepting false positives from variable benchmarks or missing real regressions in stable ones.

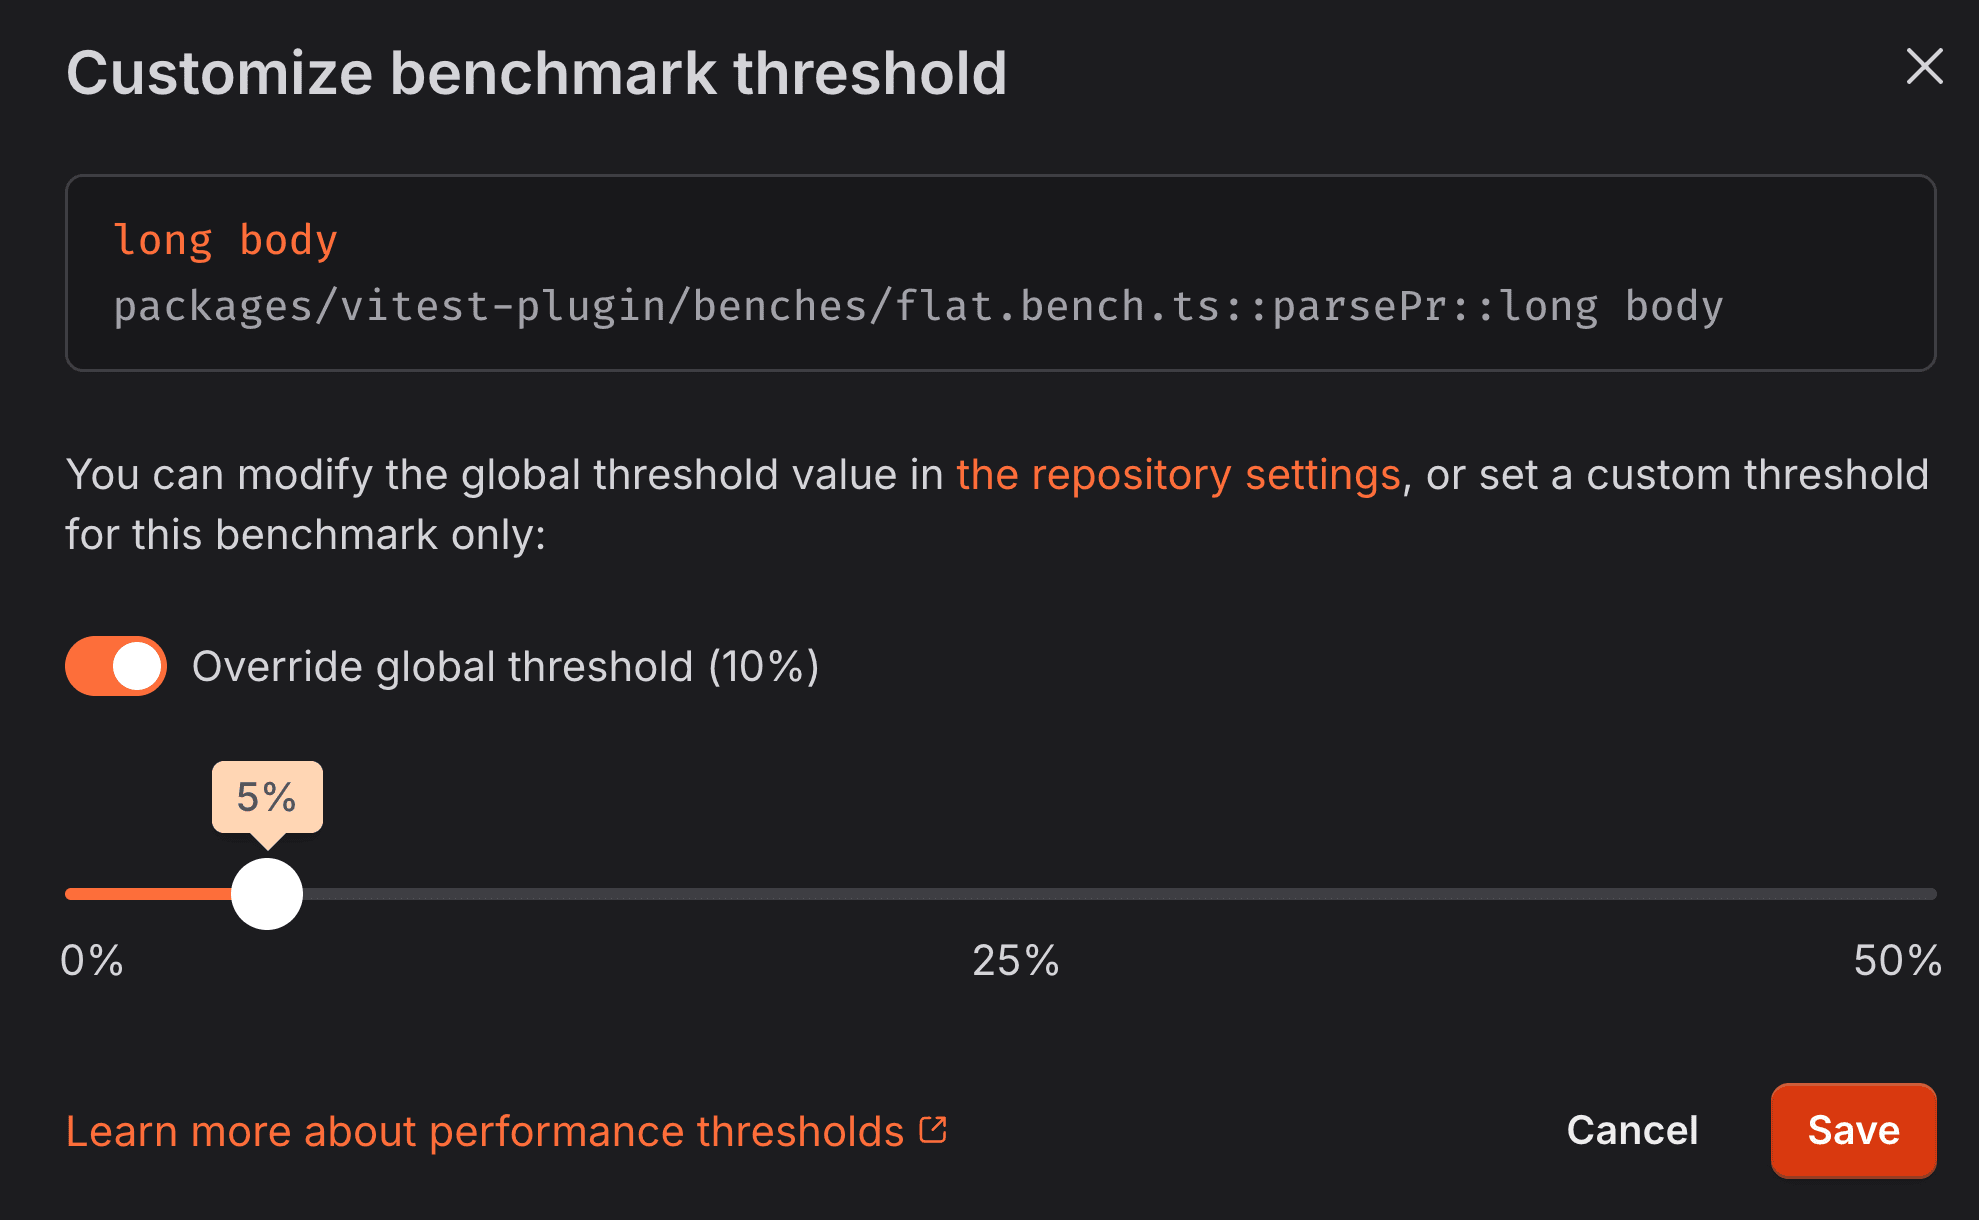
Configuration modal for setting custom regression threshold

Set a custom threshold between 0% and 50% for any benchmark

You can now set custom regression thresholds for individual benchmarks. Be strict for stable microbenchmarks using the CPU simulation instrument, and more lenient for macro-benchmarks with the walltime instrument that may have more inherent variability.

Each benchmark gets the right threshold for its characteristics, helping you catch real performance issues without false positives.

Learn more

Check out our documentation to learn more about:

Read more

Oct 29, 2025

Better granularity with Inlining Information

Better granularity with Inlining Information

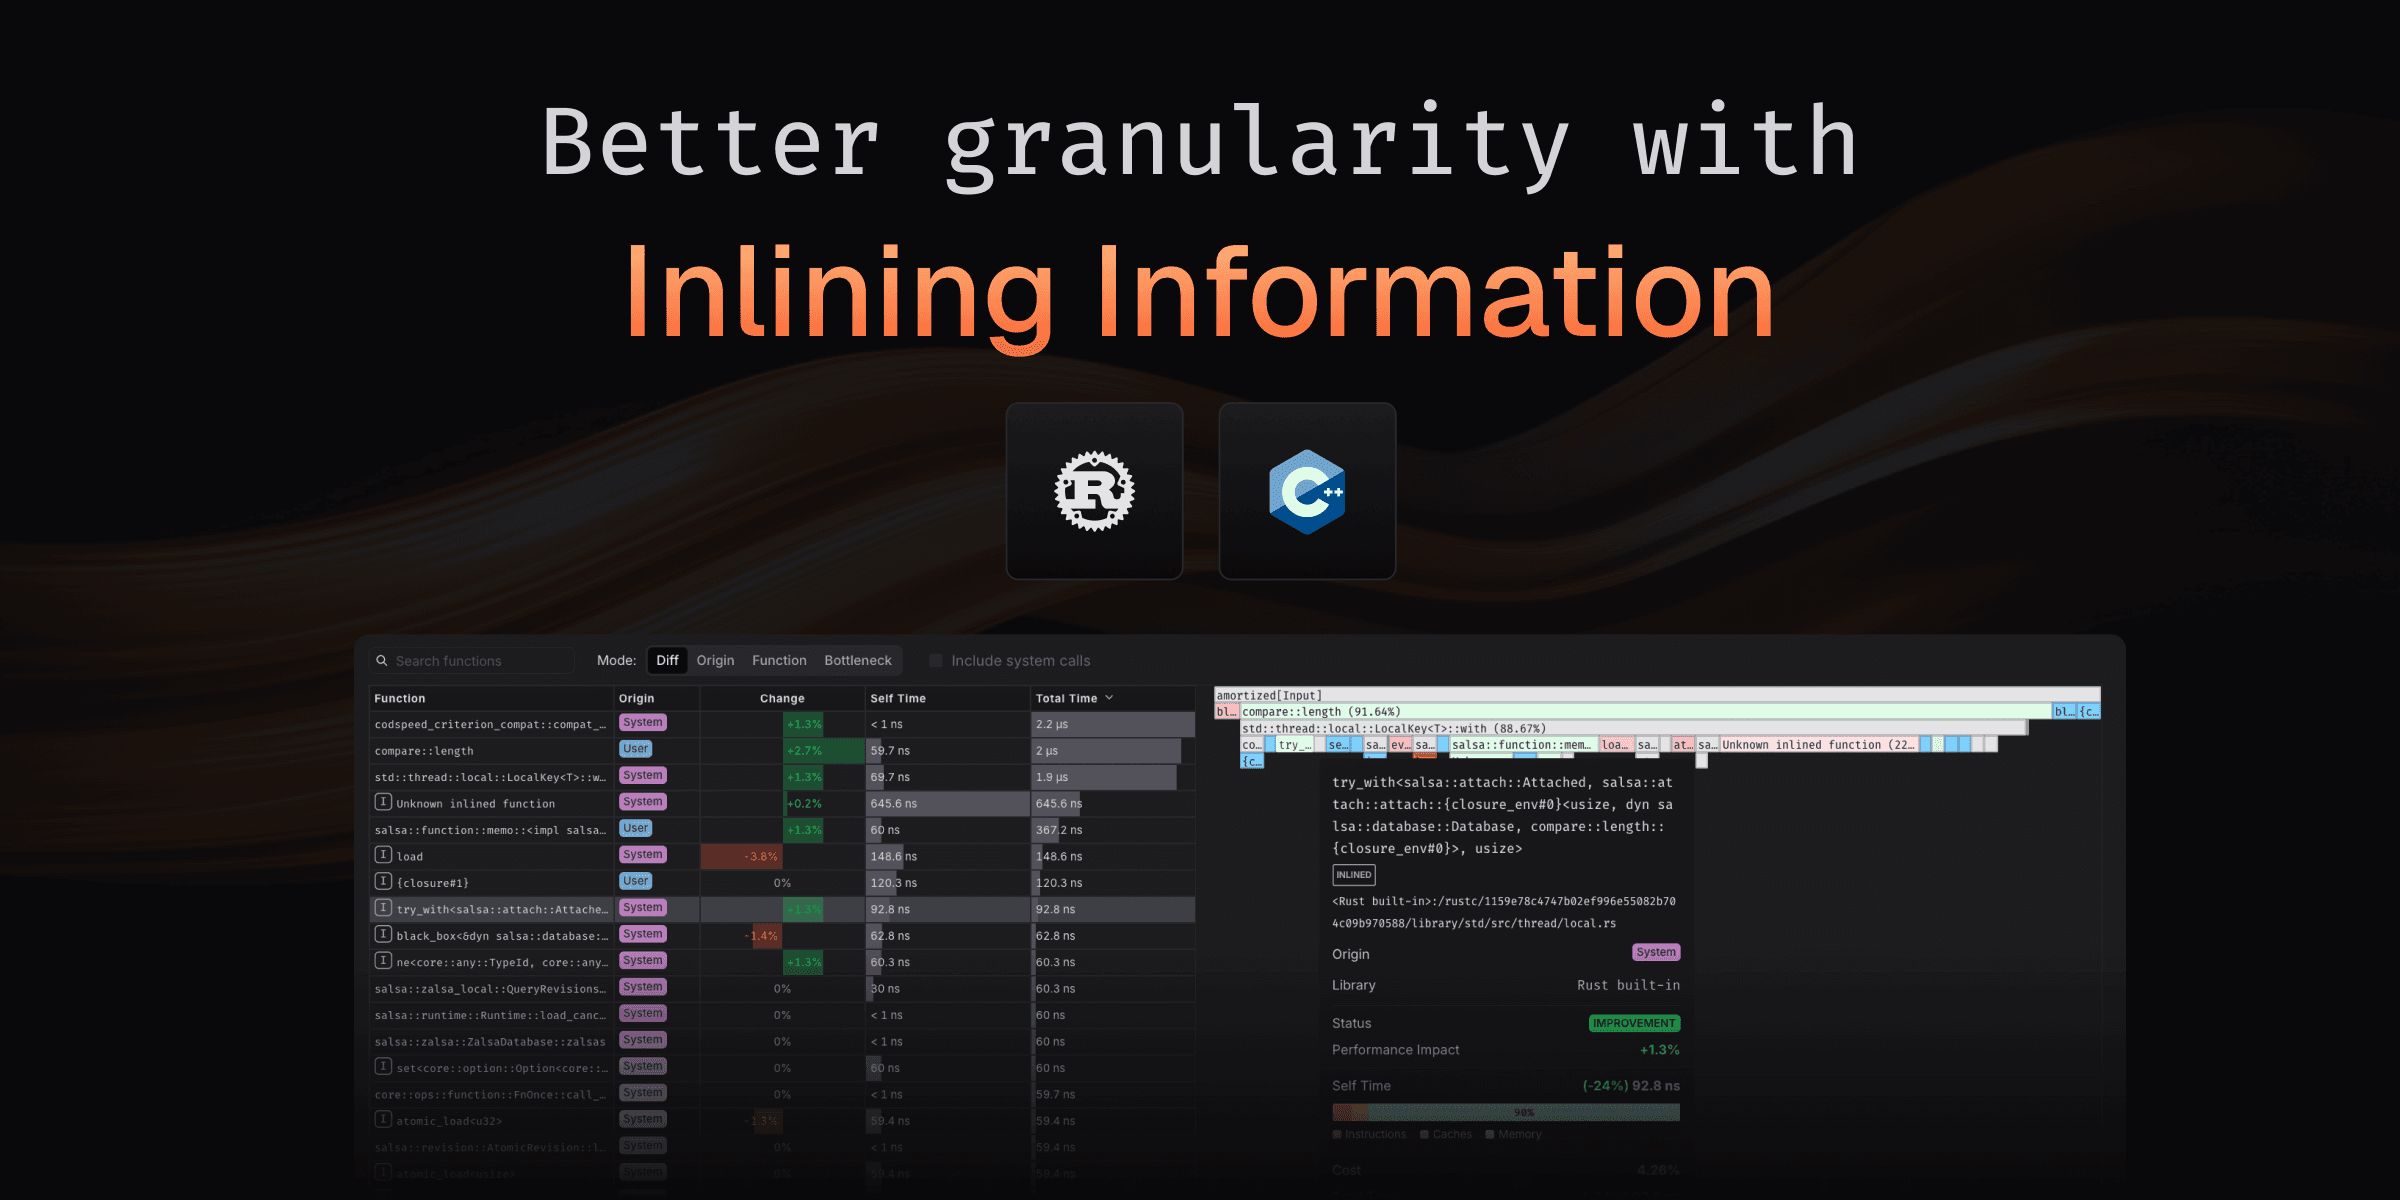
Ever compared two benchmark runs and wondered why performance changed when you didn't touch the code? Often, the culprit is function inlining: a compiler optimization that can make frames appear to vanish from your flamegraphs.

Now, CodSpeed automatically detects and displays inlined frames in your flamegraphs, giving you complete visibility into how compiler optimizations affect your performance profile.

What you get

When viewing differential flamegraphs, inlined frames are explicitly marked, so you can instantly tell whether performance differences are due to:

  • Compiler optimization changes between builds
  • Different optimization flags (-O2 vs -O3)
  • Actual code changes in your application

This makes it easier to understand mysterious performance shifts, especially when comparing:

  • Builds with different optimization levels
  • Before and after dependency updates
  • Code changes that may affect inlining decisions

How it works

The inlining information is automatically detected and displayed when using the CPU simulation instrument, no configuration needed. Inlined frames appear as marked nodes in your flamegraphs, making the call graph even more complete and accurate.

See it in action

Check out this real-world example from the salsa project showing inlined frames in differential flamegraphs:

Interactive flame graph — open the full entry →

Check out the complete run

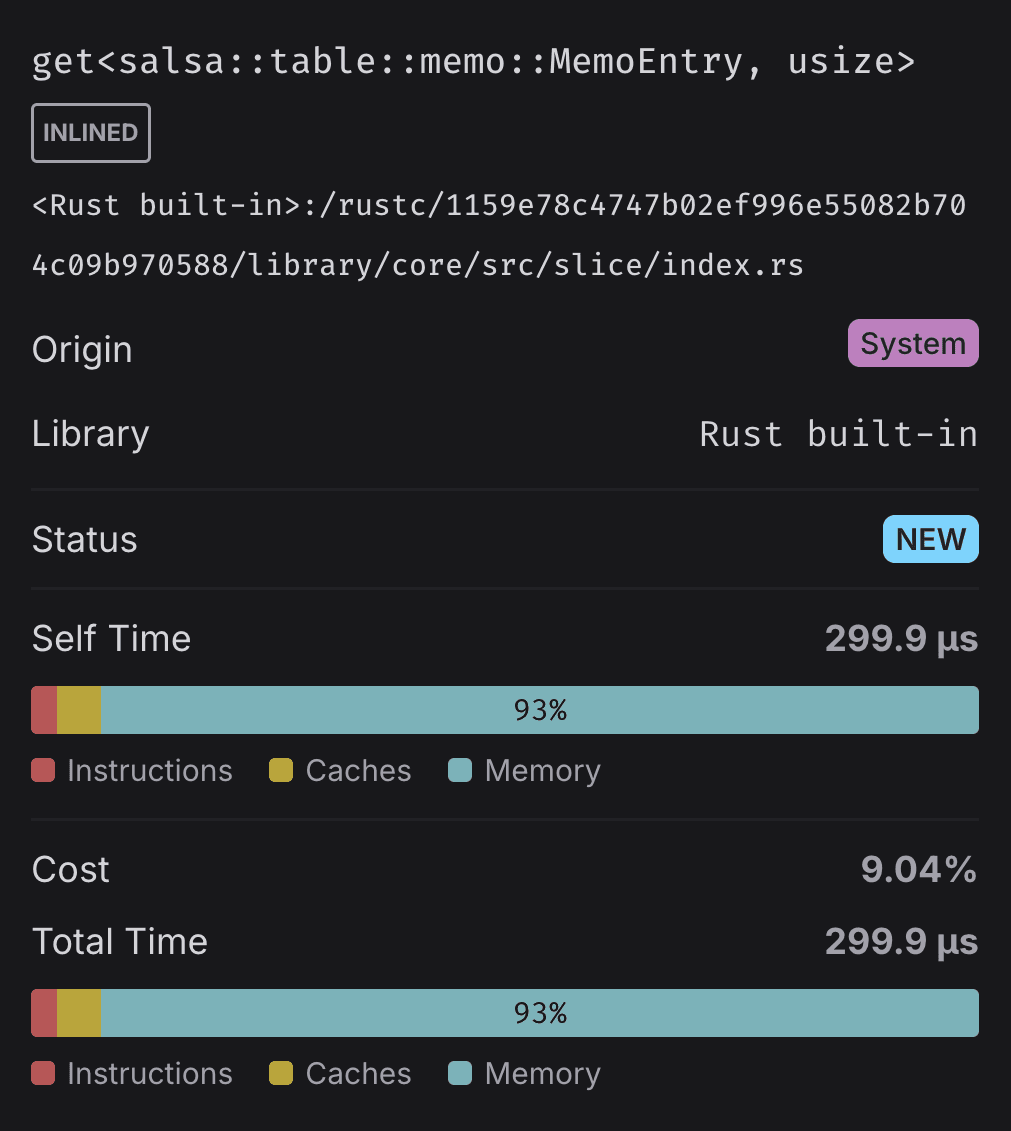
When you hover over a frame in the flamegraph, you'll see whether the frame was inlined, giving you complete visibility into both your code and compiler optimizations.

Inlined frame tooltip showing detailed information

Tooltip with inlined frame information

Get started

This feature is available with CodSpeedHQ/action v4.3.1 and later. If you're using the @v4 shorthand, you're already good to go! Otherwise, update your workflow to use @v4.3.1 or later.

Read more

Oct 17, 2025

Technical Improvement

Runs just got 2 minutes faster!

Runs just got 2 minutes faster!

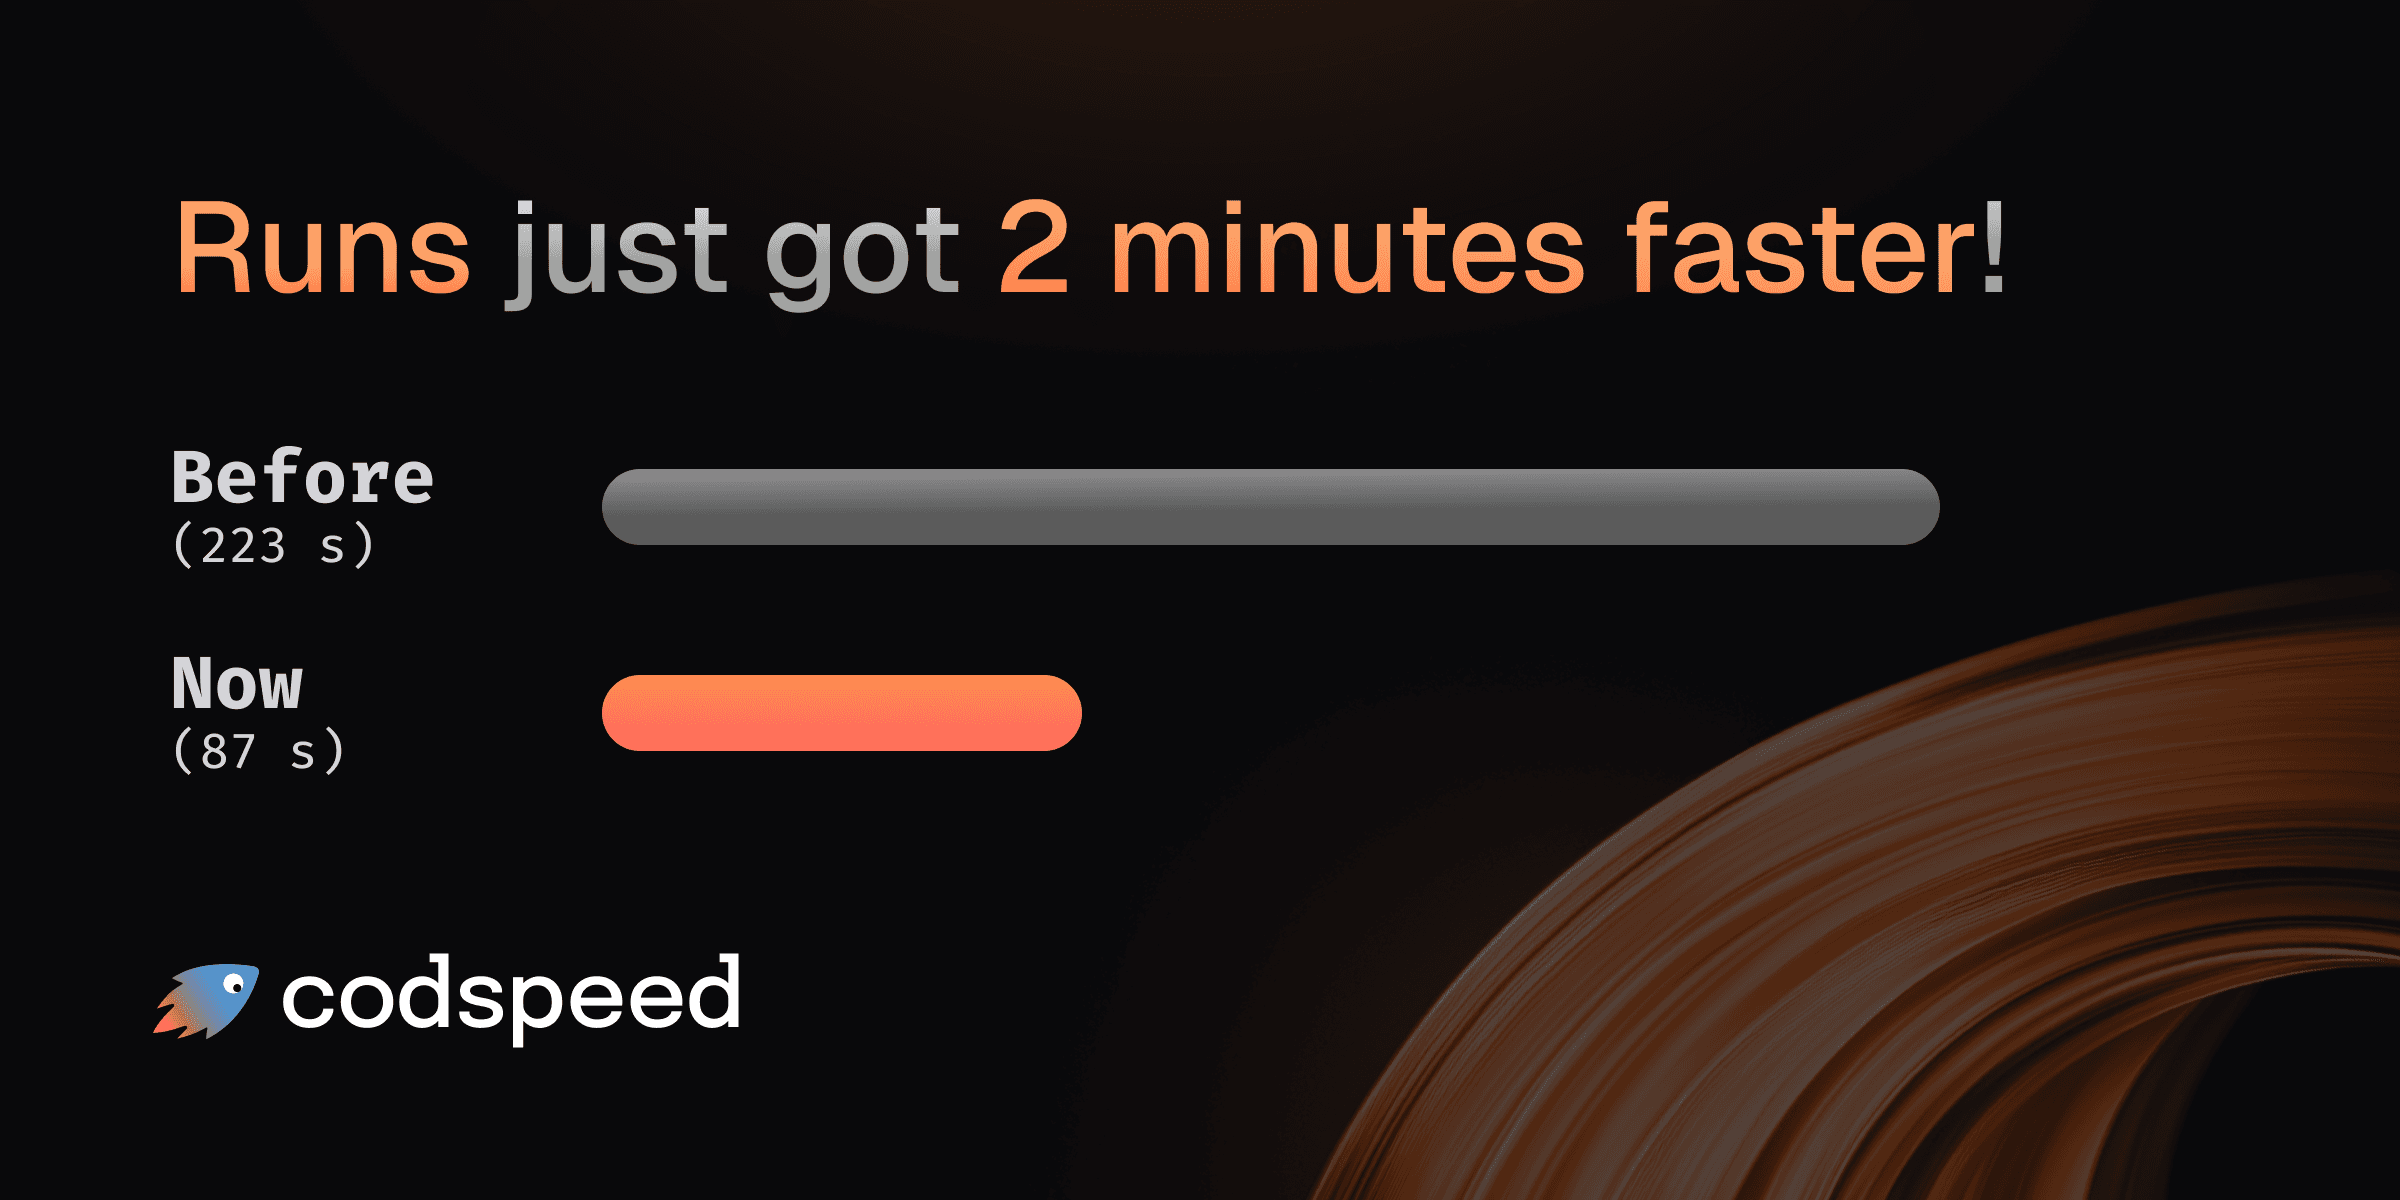
Upgrading to the latest CodSpeedHQ/action release enables caching of instrument installations (like valgrind or perf), removing the per-run apt install overhead. In practice this cuts about 2 minutes off most CodSpeed Action runs.

If you're using the shorthand @v4 version of the action, you're already good to go! Otherwise, just bump the action version to @v4.2.0 or later.

And voilà! 🎉 Your performance feedback loop just got 2 minutes faster.

How we got there?

A few weeks ago, a tweet by Boshen, the creator of oxc project, highlighted that the CodSpeed GitHub Action was taking 2 minutes just to install dependencies. His investigation revealed that most of the time was spent working on man-db updates. Bypassing this made him already save 80s from the installation time.

While this could be done by the CodSpeed action automatically, we don't feel comfortable changing the host machine behavior and we believe this should be done in the runner image directly.

Still, we realized that we could leverage the Github Actions cache to speed up even more this process, completely caching the APT installation of the dependencies.

This led us to go from 223.3 seconds to 87.4 seconds on a sample project. Effectively saving 136 seconds (more than 2 minutes) per run1.

If you're using CodSpeed Macro Runners, the instruments are already installed in the image so it's even more efficient.

Customizing the cache behavior

This new caching mechanism adds 2 action options to customize the behavior:

- uses: CodSpeedHQ/action@v4
  with:
    # ...

    # [OPTIONAL]
    # Enable caching of instrument installations (like valgrind or perf) to speed up
    # subsequent workflow runs. Set to 'false' to disable caching. Defaults to 'true'.
    cache-instruments: "true"

    # [OPTIONAL]
    # The directory to use for caching installations of instruments (like valgrind or perf).
    # This will speed up subsequent workflow runs by reusing previously installed instruments.
    # Defaults to $HOME/.cache/codspeed-action if not specified.
    instruments-cache-dir: ""

Learn more in the CodSpeedHQ/action repository.

Footnotes

  1. Average saving measured on 20 runs, source. ↩

Read more

Oct 14, 2025

Introducing Walltime Profiling Across Languages

Introducing Walltime Profiling Across Languages

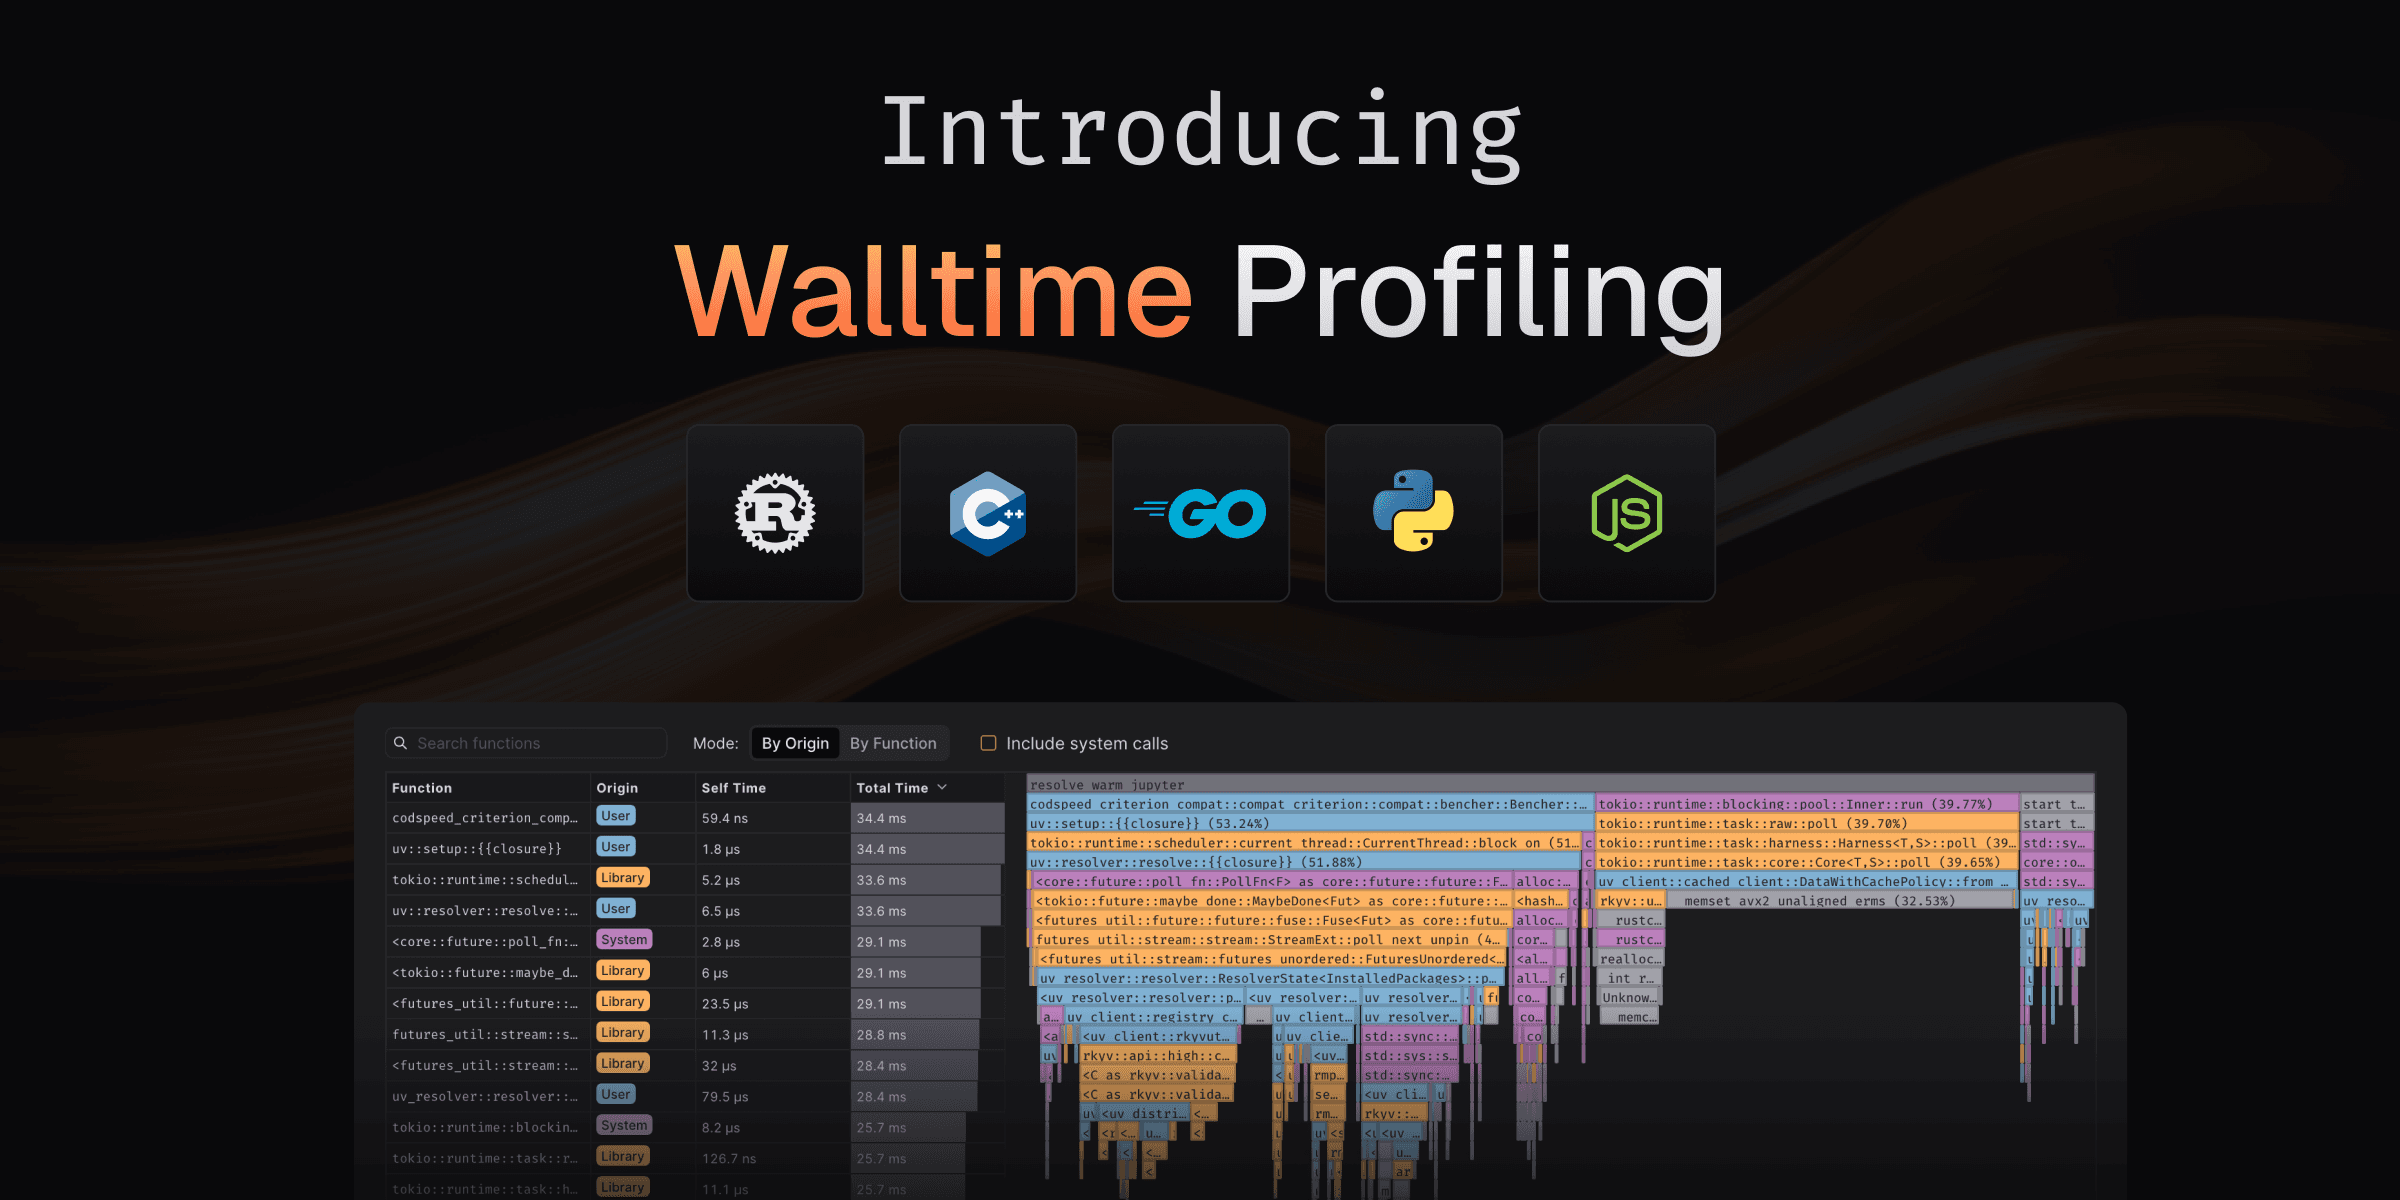
Walltime measurements now come with full profiling support, giving you detailed flamegraphs to understand where your real-world performance bottlenecks are coming from. Using perf under the hood, you can now profile not just CPU-bound code but also I/O, network operations, and other system-level interactions.

This profiling support is now available by default for Rust, C/C++, Python, Go, and Node.js when using the Walltime instrument.

Why This Matters?

Until now, the Walltime instrument gave you the total execution time, essential for understanding real-world performance but finding the specific bottlenecks required additional tools. Now, you get both the measurement and the insights in one place.

Whether you're optimizing database queries, network requests, or file I/O, you can see exactly which functions are consuming time and make targeted improvements.

How It Works?

Walltime profiling uses perf to capture stack traces during benchmark execution, building detailed flamegraphs that show:

  • Function-level breakdowns
  • Differential flamegraphs
  • Origin identification (User, Library, System)

Learn more about profiling in our documentation.

No configuration changes needed—if you're already using Walltime, profiling data will automatically appear in your benchmark results.

For the best results, we recommend using the Walltime instrument on CodSpeed Macro Runners, bare metal instances optimized for performance measurement, making sure the profiles will be consistent across CI runs.

jobs:
  benchmarks:
    name: Run benchmarks
    runs-on: codspeed-macro
    steps:
      - uses: actions/checkout@v4
      # ...
      - name: Run benchmarks
        uses: CodSpeedHQ/action@v4
        with:
          mode: walltime
          run: "<your benchmark command>"

Learn more about the Walltime instrument and explore how profiling can help you optimize real-world performance!

Read more

Sep 11, 2025

Only bench what matters with Partial Runs

Only bench what matters with Partial Runs

With your projects becoming larger, you might end up with long-running benchmark workflows, degrading the performance feedback loop and using a lot of resources in your CI.

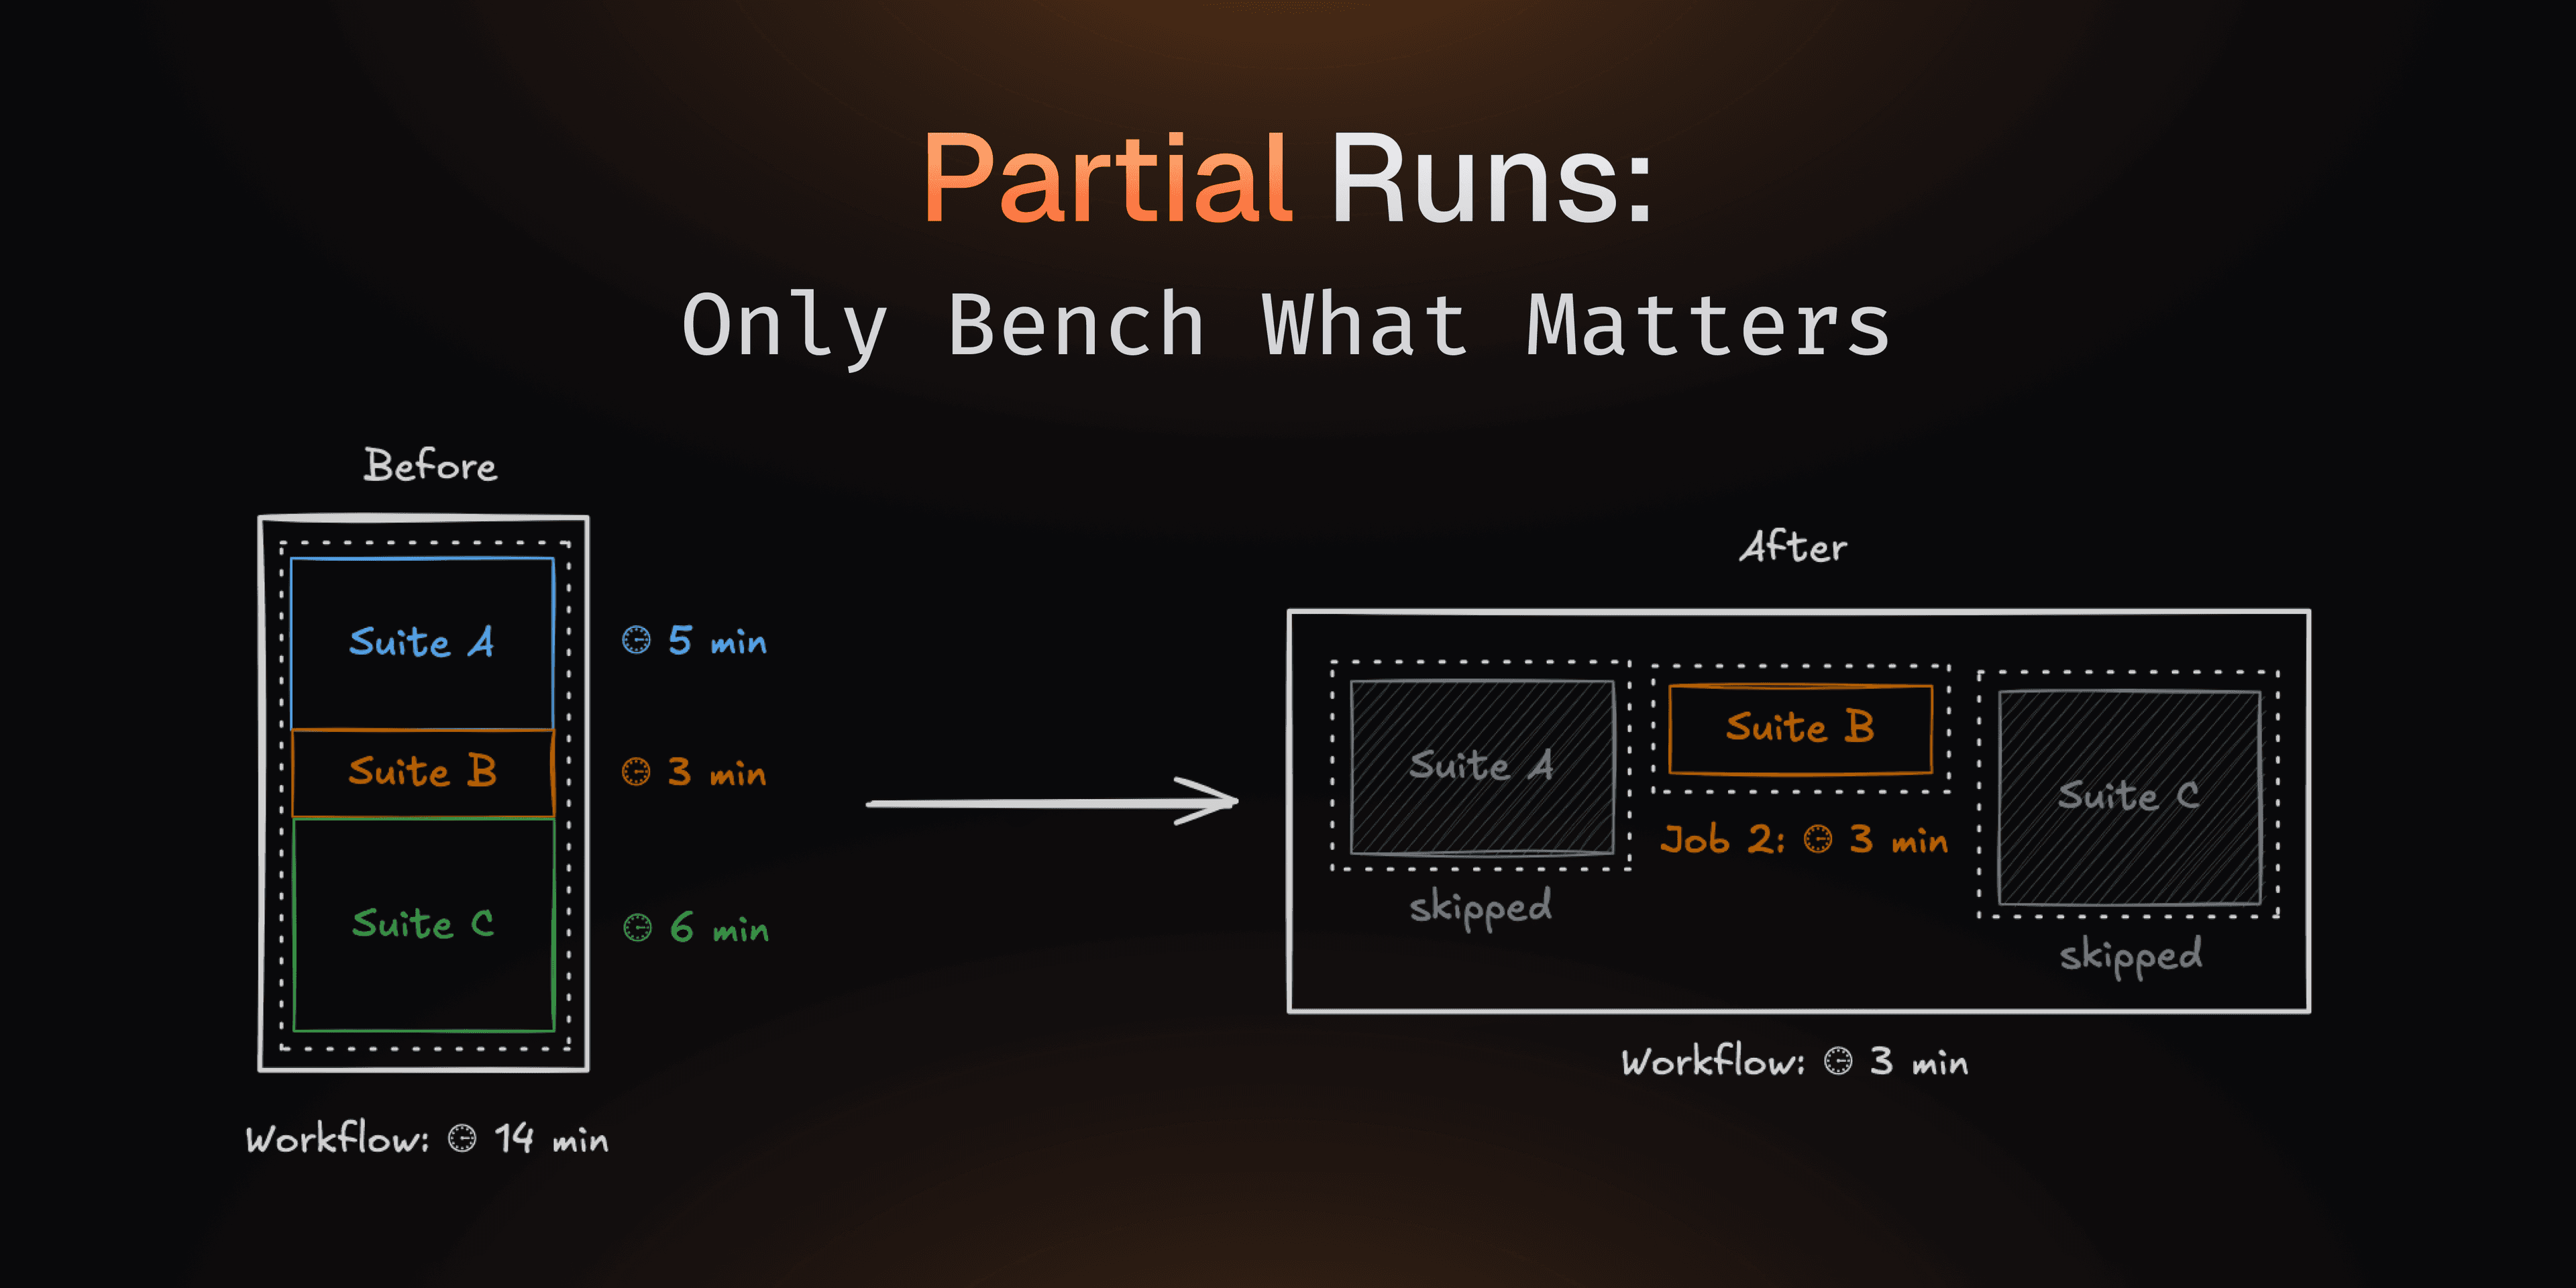
Now you can solve this with Partial Runs and only run a subset of the benchmarks that are defined in your codebase.

For example you can only run benchmarks relevant to the code changes in a pull request, or run a subset of long-running benchmarks on a schedule.

Partial Runs

From now on, you can run only a subset of your benchmarks in a CI workflow. You will still keep a complete performance history of your codebase, since the benchmarks that are not run will be marked as "skipped" and use the results from the base run.

Handling removed benchmarks with Benchmark Archival

To keep your reports clean and relevant, you will now be able to archive benchmarks that were removed from your codebase.

When you remove a benchmark from your codebase and make a new commit, it will first be marked as "skipped" due to the Partial Runs feature. You can then archive it to remove it from from future reports, while still keeping its history for reference.

Learn more about Partial Runs and Benchmark Archival!

Read more

Sep 08, 2025

More Free Macro Runners minutes

More Free Macro Runners minutes

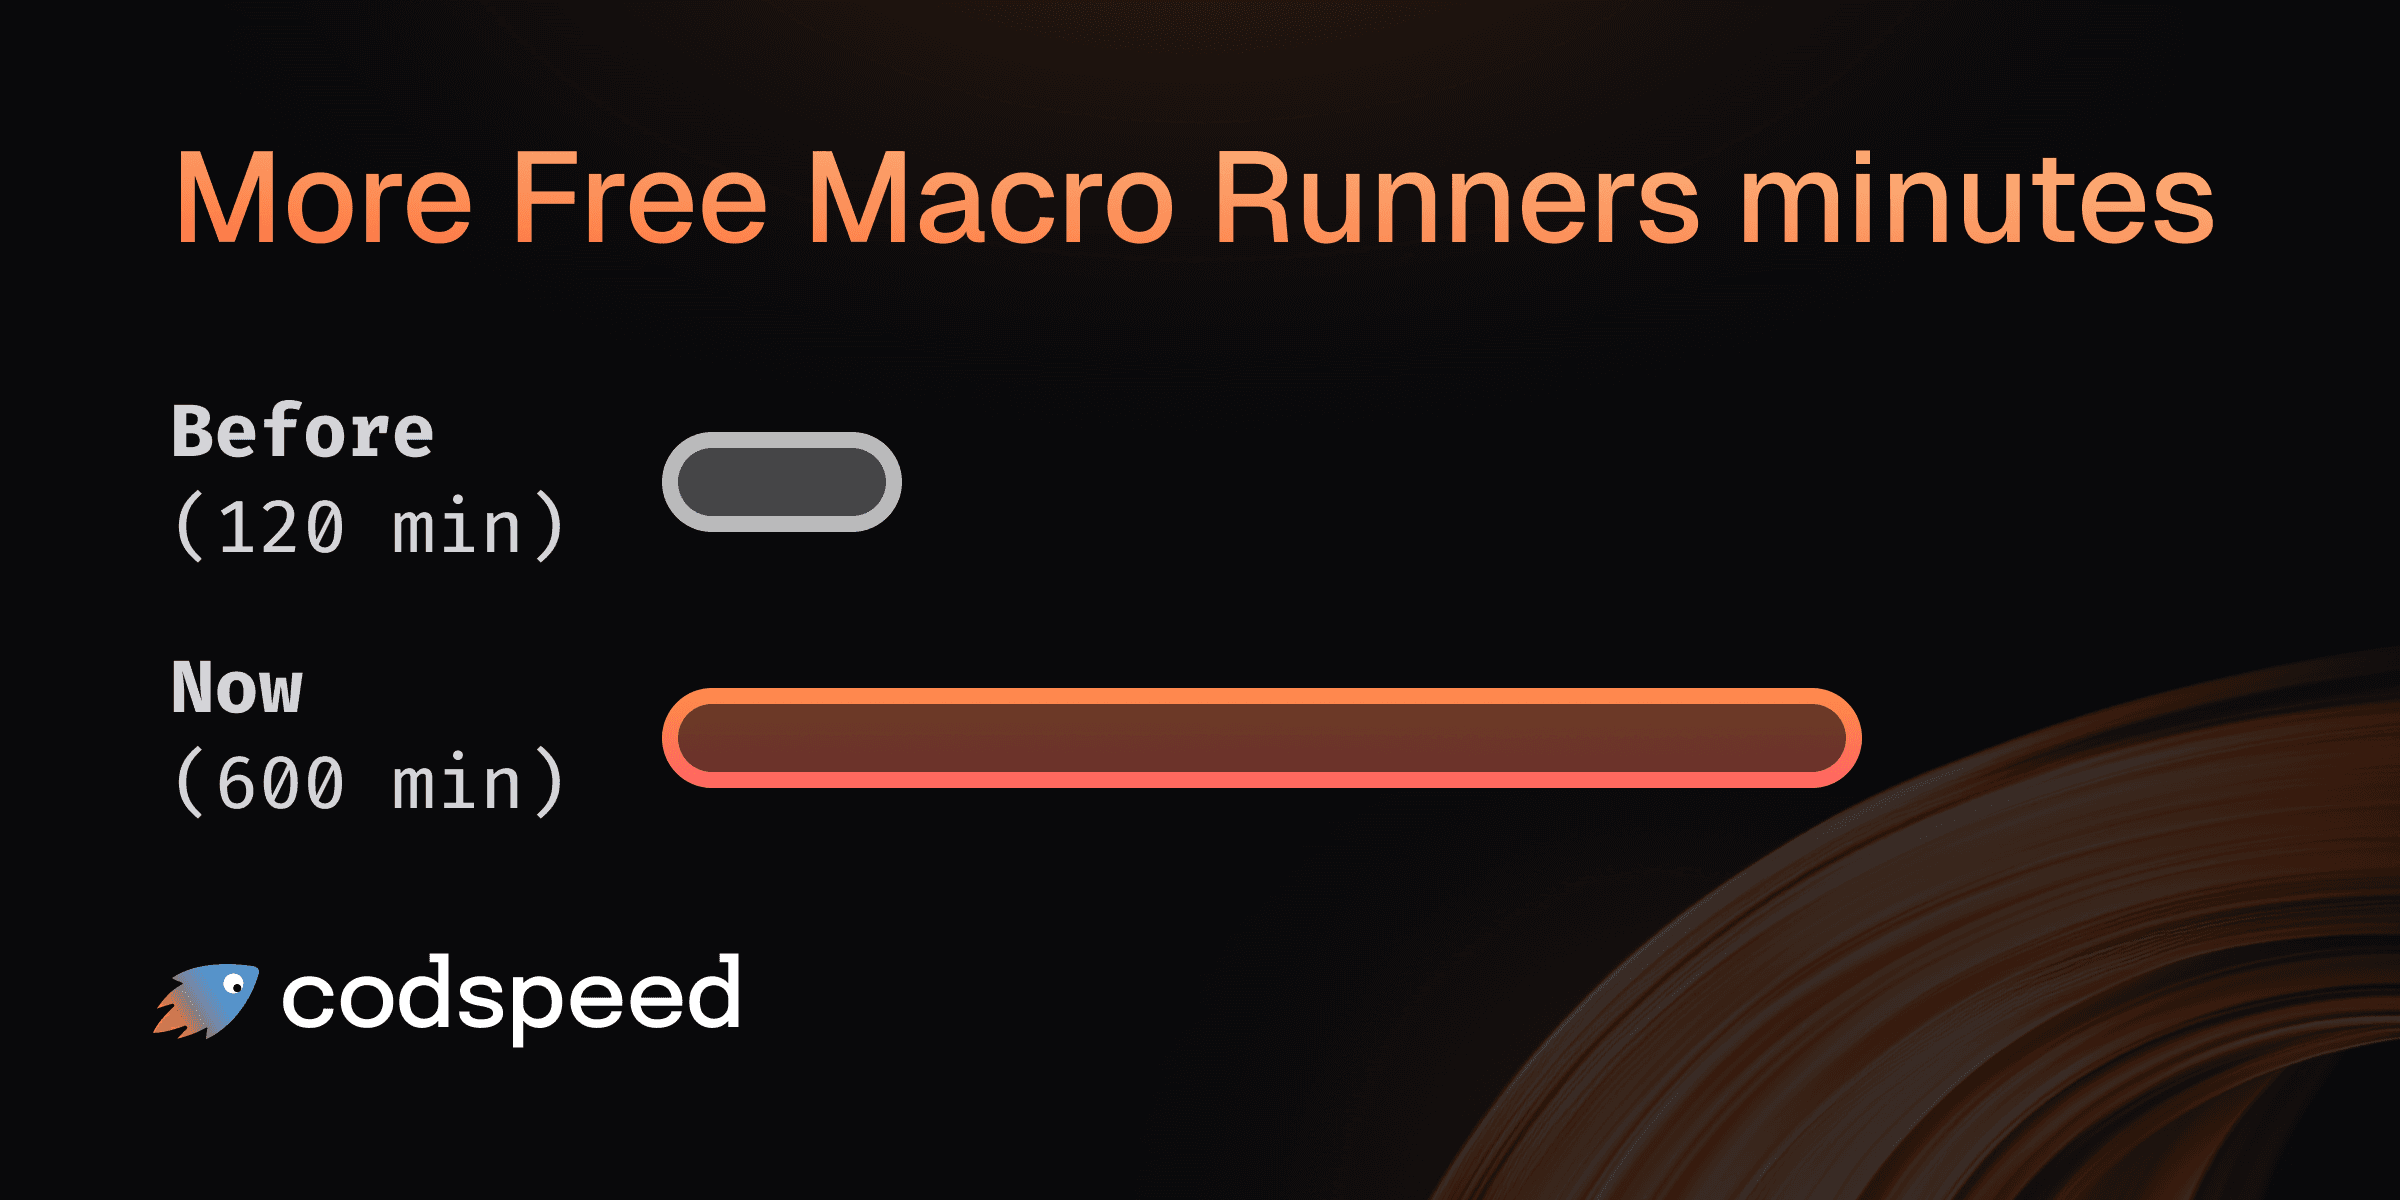
Starting today, every plan comes with 600 free macro runner minutes per month (previously 120) for the Walltime instrument. That's more room to run your benchmarks without worrying about hitting limits.

Open Source Boost

Working on an open source project? We'll happily grant even more minutes. Just send us a note with a few details about your repo.


👉 Create a free account and try it out, and check out our pricing for more information!

Read more

Sep 04, 2025

Go

Go Support

Go Support

You can now use CodSpeed to benchmark Go codebases with the standard testing package and your existing go test workflow! No code changes required!

The integration is available in our codspeed-go repository.

Quick Start

CodSpeed works with your regular go test -bench runs. Write benchmarks with testing and CodSpeed will discover and run them.

Here is a simple example:

// fib_test.go
package example

import "testing"

func fib(n int) int {
  if n < 2 {
    return n
  }
  return fib(n-1) + fib(n-2)
}

func BenchmarkFibonacci10(b *testing.B) {
  // Preferred loop helper for precision
  for b.Loop() {
    fib(10)
  }
}

func BenchmarkFibonacci20(b *testing.B) {
  // Traditional pattern also supported
  for i := 0; i < b.N; i++ {
    fib(20)
  }
}

Check out our Go documentation for all details on how to get started!

Read more

We handle performance, so you can focus on shipping.

Talk to our team about deployment, security, and scale; or start building today.