Meet the Memory Instrument: Track Memory Consumption Too
Performance isn't just about execution time—memory consumption matters just as much. Memory leaks, excessive allocations, and growing peak usage can silently degrade performance or cause unexpected behavior in production.
The new Memory Instrument automatically tracks memory allocations, deallocations, and peak consumption during every benchmark run, helping you identify memory bottlenecks before they become problems.
What You Get
Every memory-instrumented benchmark run now includes comprehensive memory metrics that help you understand allocation behavior:
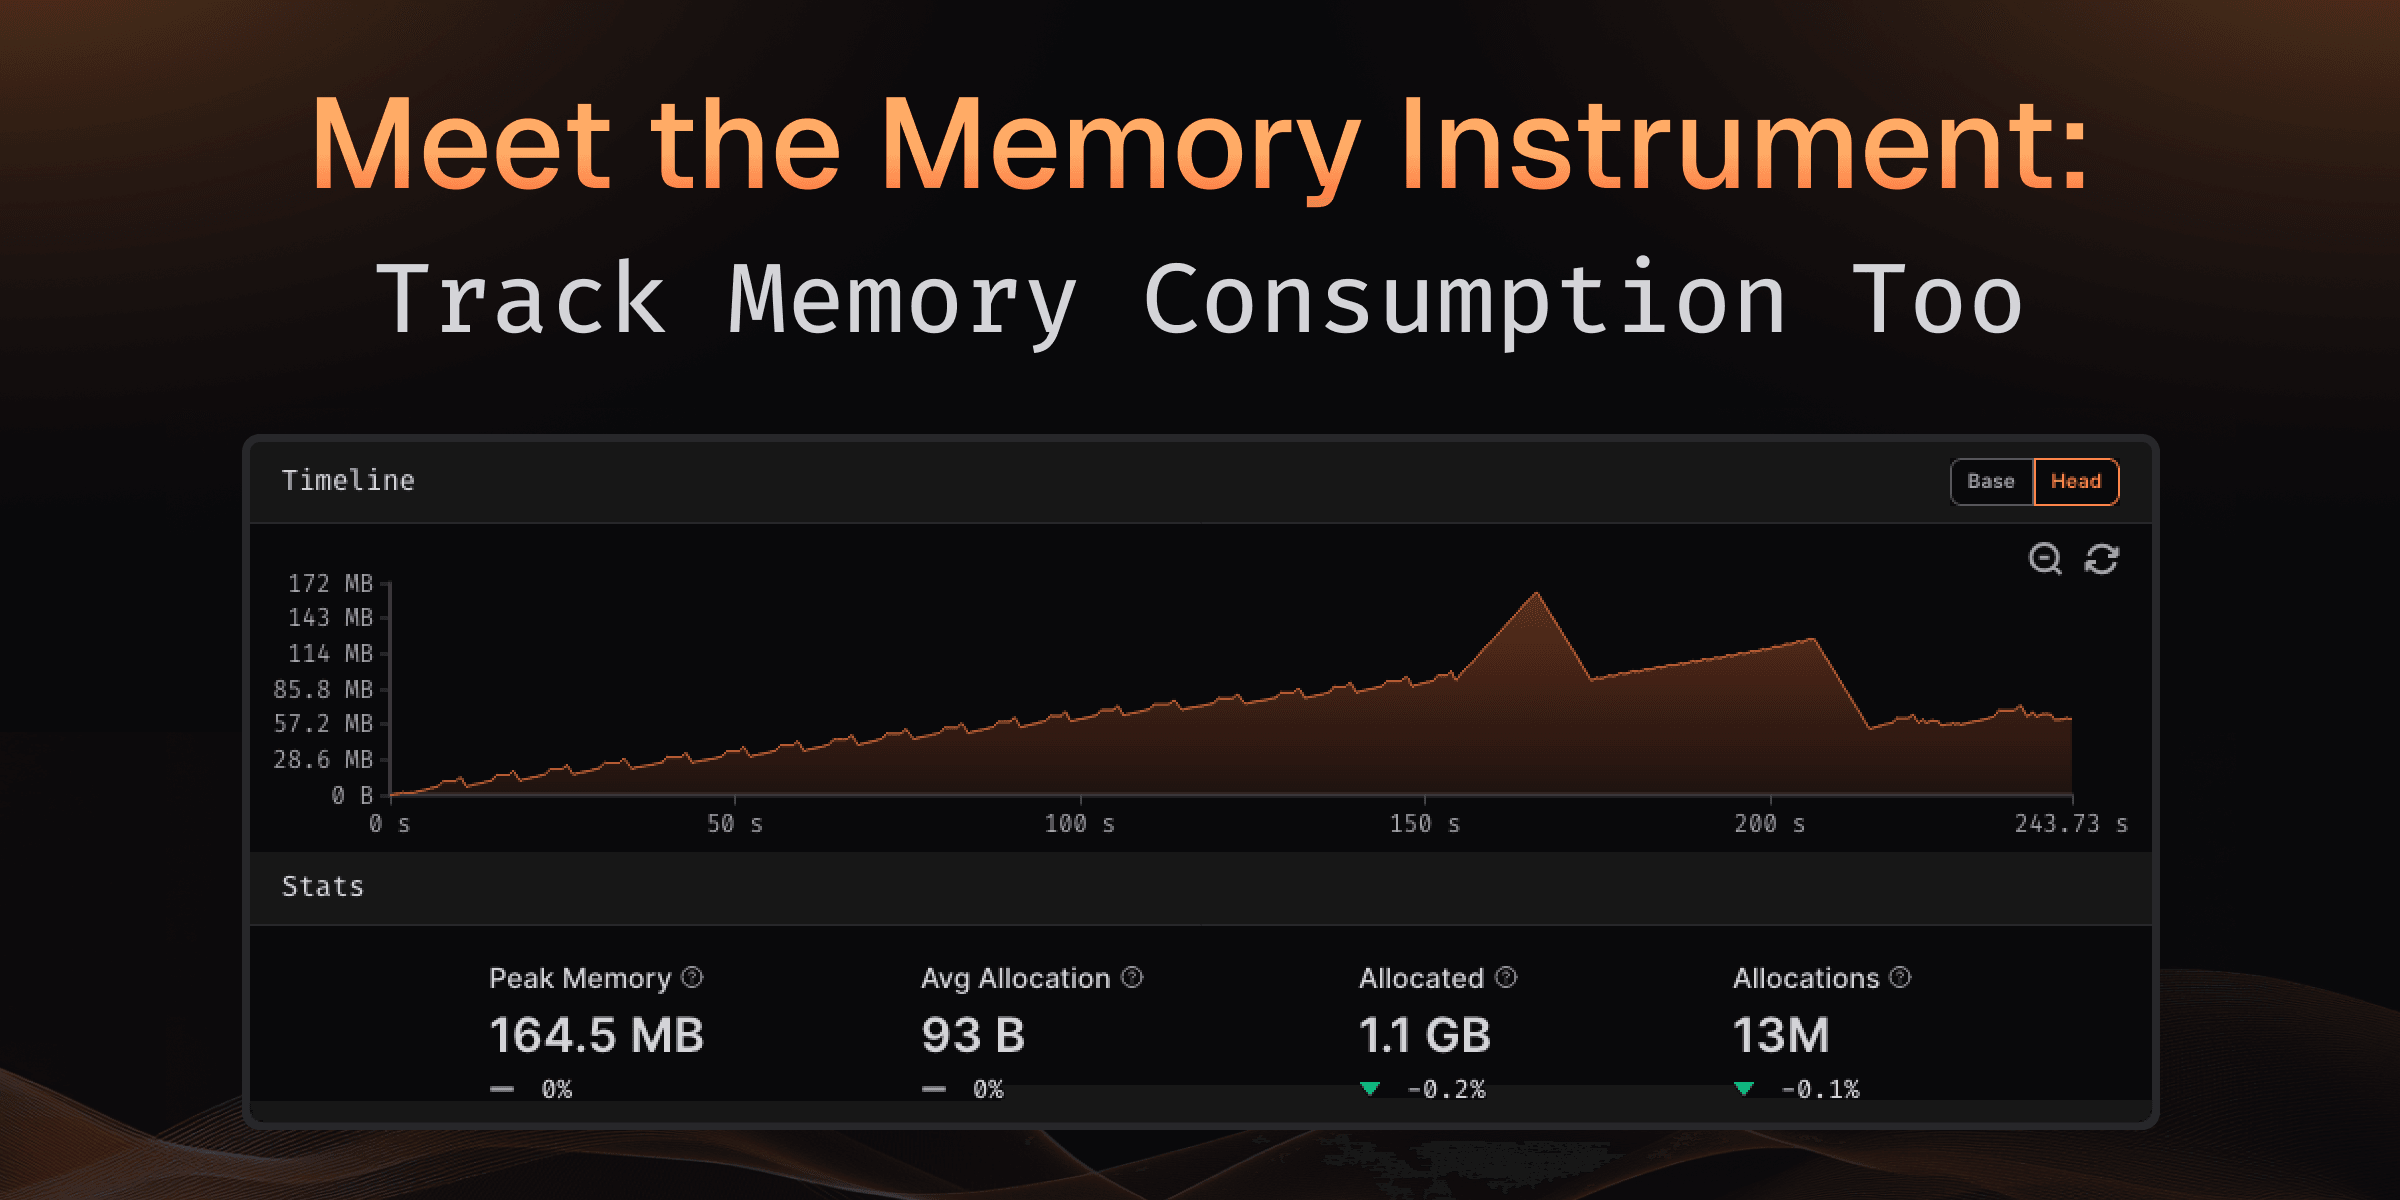
Memory Statistics
- Peak Memory: Maximum memory consumed during benchmark execution
- Average Allocation Size: Mean size of individual memory allocations
- Total Allocated: Cumulative memory allocated throughout execution
- Total Allocations: Number of allocation operations performed
All metrics show comparison between baseline and current runs, with clear indicators of whether memory usage increased or decreased.
Memory Timeline Visualization
The timeline graph shows exactly how memory consumption changes throughout your benchmark:
- Real-time tracking: See memory allocations and deallocations as they happen
- Peak identification: Quickly spot when and where peak memory occurs
- Zoom and pan: Navigate through the timeline to examine specific periods
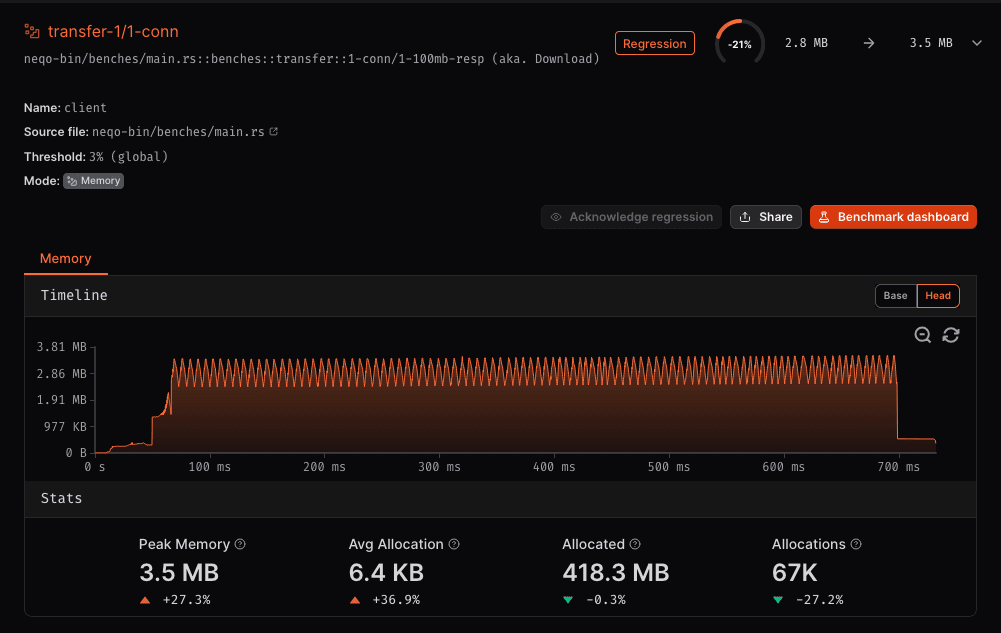
Finding Memory Issues
The Memory Instrument helps you identify common memory problems:
- Growing peak memory between runs? You may have introduced a memory leak or increased working set size
- High number of allocations? Consider object pooling or reducing temporary allocations
- Large average allocation size? Review whether you're allocating more memory than necessary
- Spiky timeline pattern? Your code may benefit from pre-allocation or memory reuse strategies
What's Coming Next?
We're continuing to expand memory analysis capabilities:
- Memory leak detection: Automatic identification of memory that wasn't freed
- Allocation hotspots: Flame graphs showing which functions allocate the most memory
- Garbage collection metrics: Track the impact of GC on memory usage and performance
The Memory Instrument gives you the visibility you need to write memory-efficient code with confidence.
Try It Now
Simply configure your workflow to use the memory runner:
- uses: CodSpeedHQ/action@v4
with:
runner: memory # Enable memory instrumentation Memory instrumentation is available on all runners now for Rust and C/C++ benchmarks, with more languages coming soon.
Learn more about the Memory Instrument.