
Changelog

New updates and improvements released to Codspeed.

Changelog

Aug 03, 2026

Runner

CodSpeed v5: Only Your Code, at Its Real Cost
CodSpeed v5: Only Your Code, at Its Real Cost

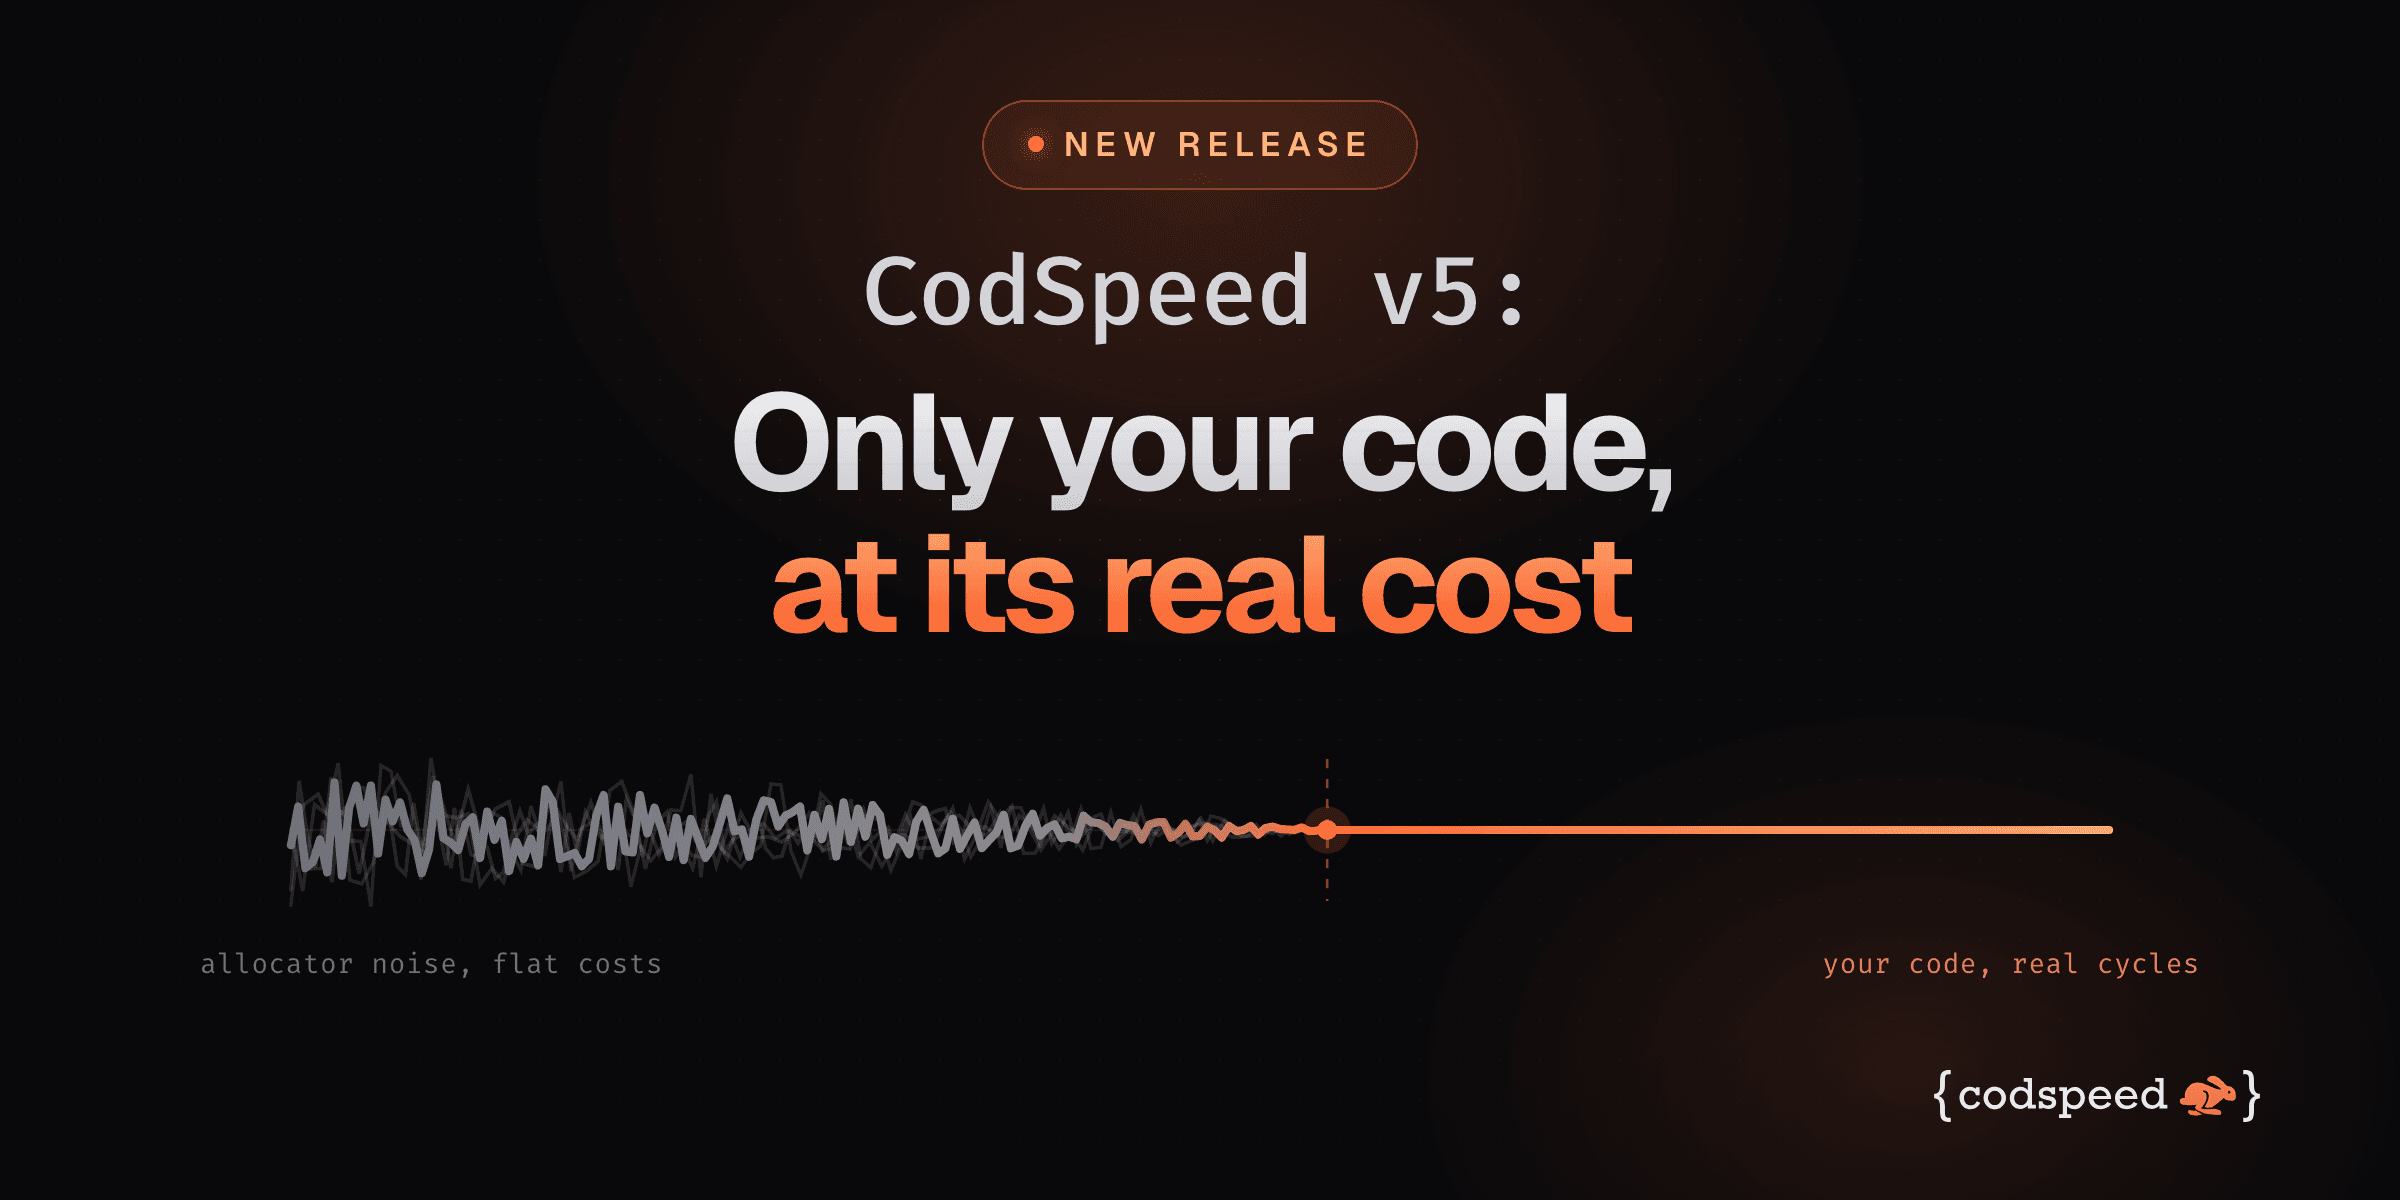
Two things stand between a benchmark and the truth: costs that don't match real hardware, and noise that isn't your code. CodSpeed v5 tackles both. Cycle estimation, now on by default, weights each executed instruction by its measured cost on real CPUs, so a div no longer counts the same as a mov. And the new allocation exclusion removes allocator time from your results entirely. Only your code, at its real cost, with the same single-run determinism.

Cycle estimation, on by default

The simulation estimates the total cycles of a benchmark from three components:

  • Executed instruction cycles: each instruction weighted by its real hardware cost, built from measured per-instruction latency and throughput data
  • L1 cache misses: data fetched from L2/L3, 10-40 cycles
  • Last-level cache misses: data fetched from RAM, 100+ cycles

You keep everything that makes Simulation mode useful: benchmarks run once, on standard CI runners, with deterministic results. The estimate just tracks real hardware much more closely. Learn more in the CPU Simulation docs.

Excluding allocator time

Allocators are one of the most common sources of benchmark variance: their cost depends on the OS, the allocator implementation, and its version. If you are optimizing your own code, that cost is noise. With the new opt-in exclude-allocations feature, CodSpeed tags every allocator frame in the call graph and subtracts its time from the reported value. The flame graph still shows the allocator frames, only the reported number changes.

Enable it with the CLI:

codspeed run --exclude-allocations -- <your bench command>

Or in GitHub Actions:

- uses: CodSpeedHQ/action@v5
  with:
    mode: simulation
    exclude-allocations: true
    run: <your bench command>

Learn more in the allocation exclusion docs.

Consistent wall-time profiles on every OS

The walltime profiler now uses our fork of samply on all operating systems, not just macOS. You get the same high-quality stacks and symbol resolution on Linux as on macOS. If you need the previous behavior, set CODSPEED_WALLTIME_PROFILER=perf.

Upgrading

To upgrade, bump the action in your workflow:

- uses: CodSpeedHQ/action@v5

Or update the CLI:

curl -fsSL https://codspeed.io/install.sh | bash

Since the cycle estimation formula changes what Simulation mode measures, runs made with v5 are not comparable with runs from earlier versions. CodSpeed detects this and marks cross-version comparisons as N/A instead of showing a misleading diff. Your first run on v5 becomes the new baseline.

Full release notes on GitHub.

Read more

Jul 28, 2026

CodSpeed is now SOC 2 Type II compliant

CodSpeed is now SOC 2 Type II compliant

CodSpeed runs inside your CI, which puts it in scope for your security review. An independent third-party auditor has now examined how CodSpeed handles your data, and CodSpeed is SOC 2 Type II compliant: the controls were tested across an observation window, not just confirmed at a single point in time.

Trust Center

The Trust Center gives a detailed overview of CodSpeed's security practices, policies, and controls, including the subprocessors that process customer data. It is the fastest way to answer a security questionnaire without waiting on a reply.

Getting the report

To request a copy of the SOC 2 Type II report, contact security@codspeed.io. What CodSpeed stores and what it never retains, including source code, is documented on the security page.

Read more

Jul 13, 2026

Process and Thread Selection in Flame Graphs

Real-world benchmarks are rarely single-threaded. Web servers spawn workers, data pipelines fan out across processes, and runtimes keep background threads busy with garbage collection or I/O. Until now, all of that activity was merged into a single flame graph, making it hard to tell what each process or thread was actually doing.

Splitting a multi-process benchmark's flame graph: the Threads selector turns the merged view into one section per process and thread

Flame graphs are now fully process and thread aware. When a benchmark involves multiple processes or threads, a new Threads selector appears in the flame graph viewer:

  • Filter: check exactly the processes and threads you want to analyze, and the flame graph and function list update to only include their samples.
  • Split Threads: instead of merging everything into one flat graph, display the full hierarchy with one section per process and thread, so you can see how the work is distributed.

Processes and threads are listed with their actual names, so finding the worker you care about doesn't require knowing its PID.

The selection also carries over to differential flame graphs: threads are matched across the base and head runs, so you can compare the exact same subset of the execution between two commits.

Available to agents in the MCP server

The same process and thread awareness ships in the MCP server's query_flamegraph tool, so your AI assistant can narrow its flame graph analysis down to a specific process or thread when investigating a multi-process benchmark.

This works across instruments, and is especially useful with walltime profiling on multi-process workloads. Learn more in the profiling documentation.

Read more

Jul 07, 2026

Environment diffs in run comparisons

Environment diffs in run comparisons

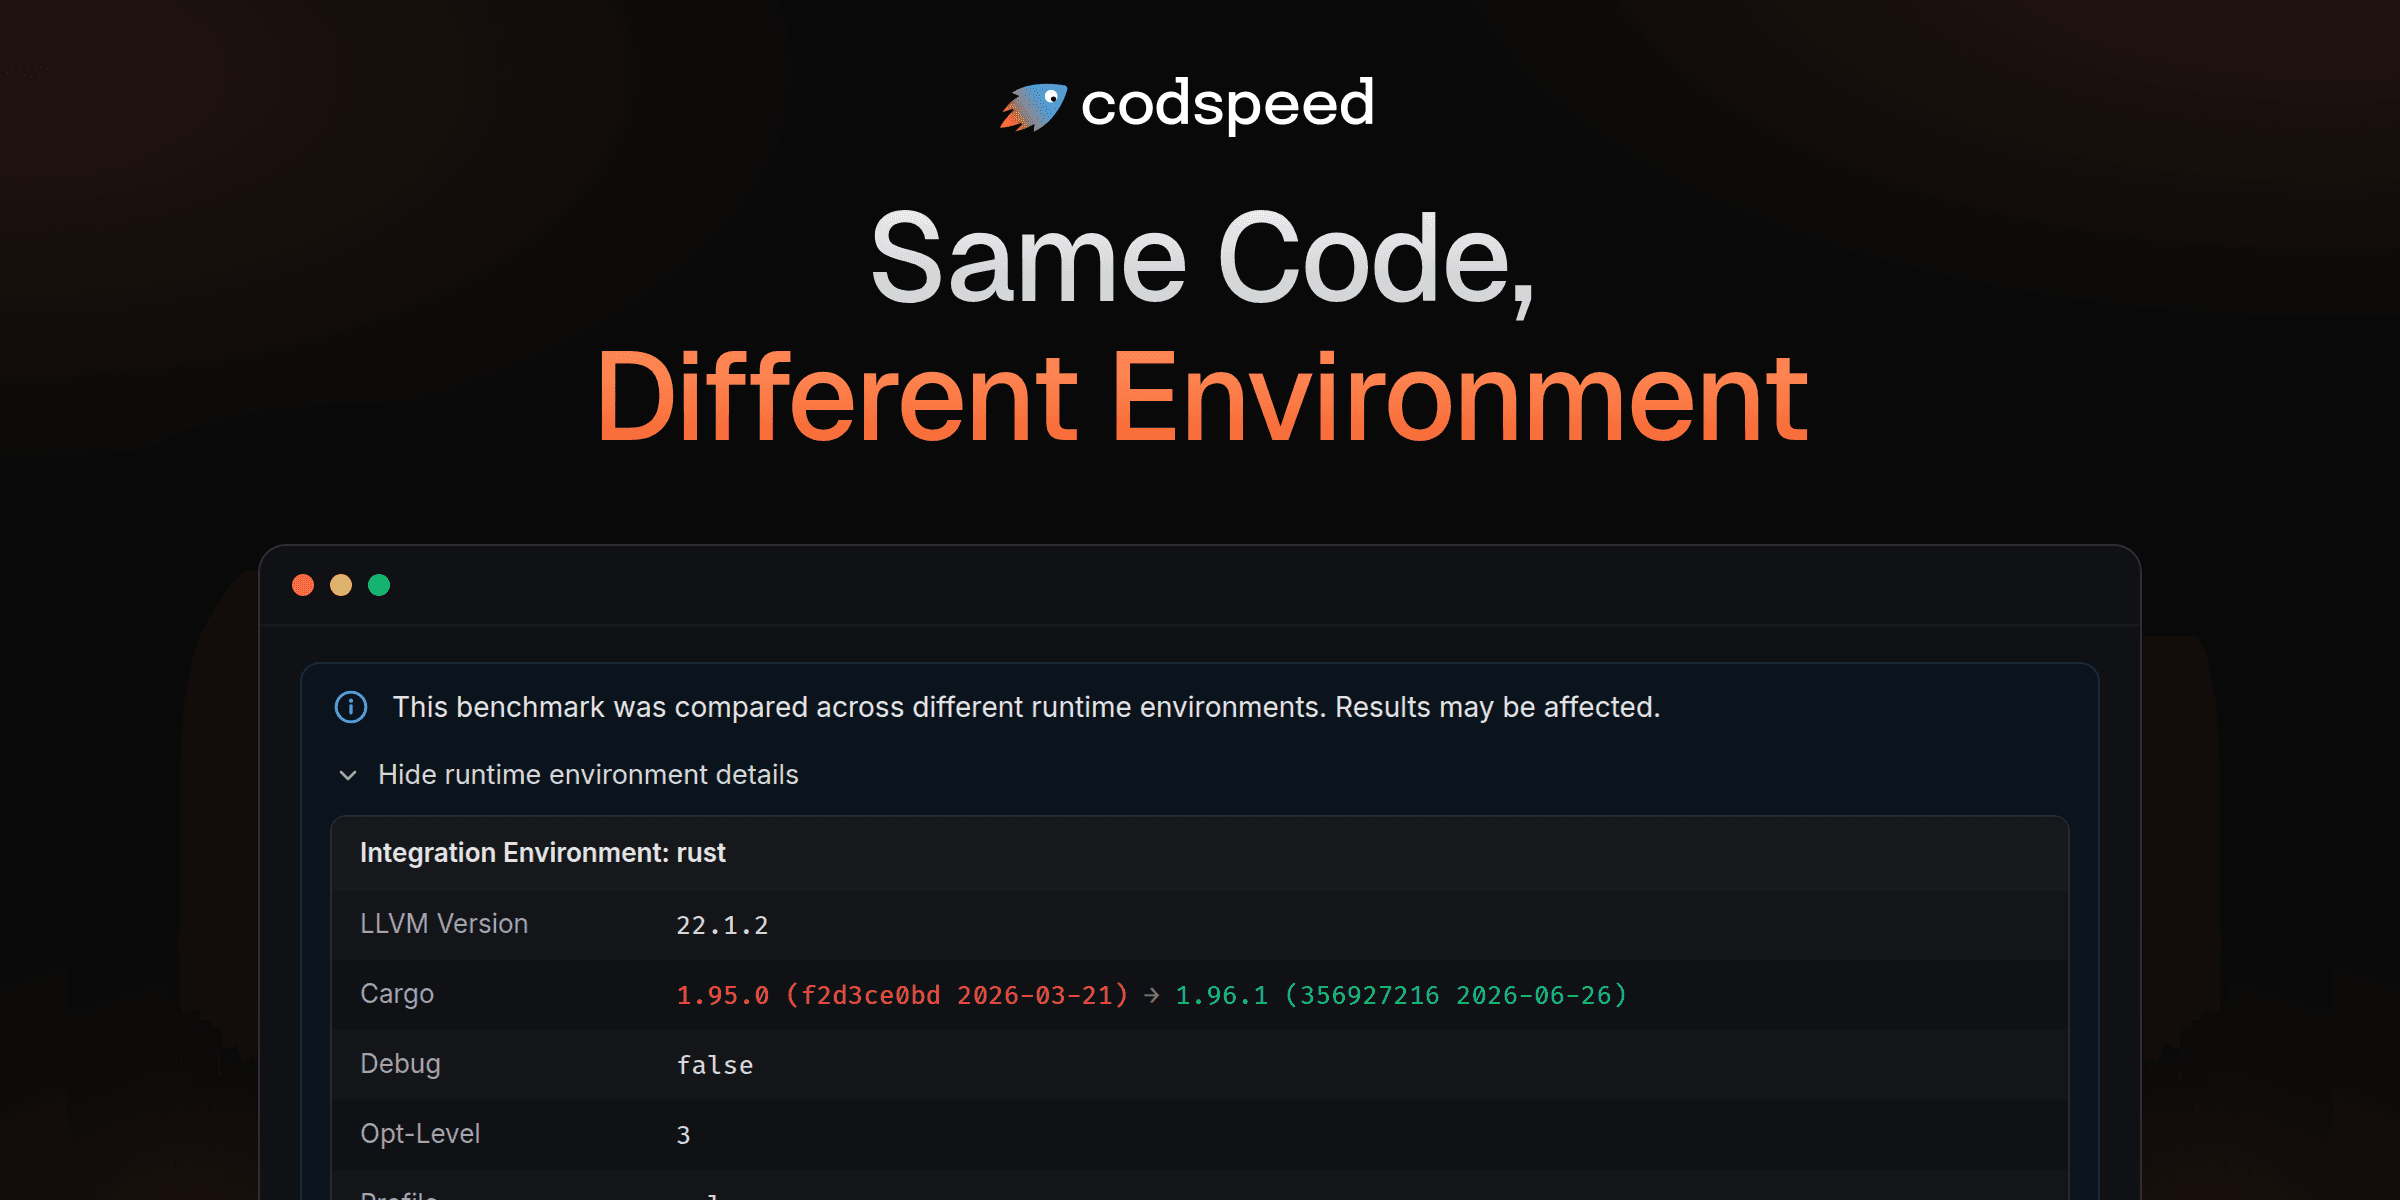
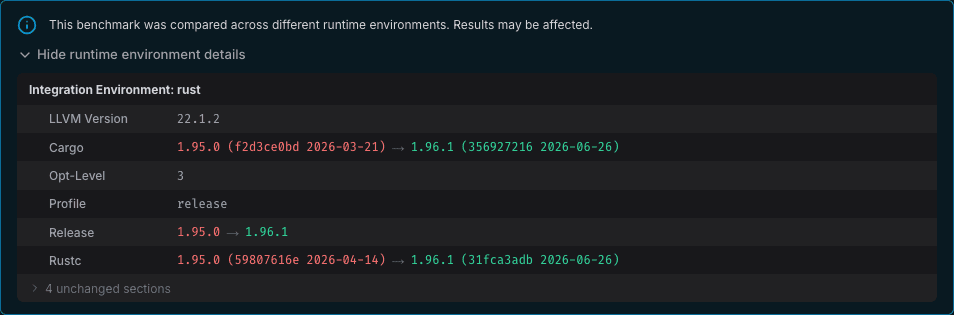
A benchmark can move without you touching a single line of code: a compiler upgrade, a new version of a system library, or a different CPU configuration can all shift the numbers. Until now, telling an environment-induced change apart from a real regression meant digging through CI logs. CodSpeed now collects detailed environment metadata with every run and diffs it whenever you compare two runs, so the likely cause is right there on the comparison page.

Environment diff on a run comparison, showing the Rust toolchain bumped from 1.95.0 to 1.96.1

A benchmark comparison where only the Rust toolchain changed: Cargo and Rustc moved from 1.95.0 to 1.96.1, while LLVM, opt-level, and profile stayed put.

What you'll see

When the two environments differ, the comparison page shows a breakdown of exactly what changed:

  • Toolchain versions: the language runtimes and compilers your integration uses (e.g. Python, Node.js, or Rust)
  • Linked libraries: the system libraries your benchmarks were linked against, version by version
  • CPU flags and hardware: differences in the underlying machine configuration

Anything identical on both sides is collapsed, so the diff only surfaces what actually changed between the base and head runs.

Available in the MCP server

The same environment diff ships in the MCP server's compare_runs report, so your AI assistant can factor environment changes into its analysis when investigating a regression.

On by default

Environment metadata is collected automatically by recent runner versions, and the diff appears on the run comparison page whenever a difference is detected. Just open any run comparison and look for the environment section.

Read more

May 06, 2026

Java

Java Support

Java Support

You can now use CodSpeed to benchmark Java codebases thanks to our new integration with JMH.

JMH is the de-facto standard for JVM microbenchmarking, designed by the OpenJDK team to deal with the complexities of benchmarking on the JVM. What it doesn't do is keep things stable across CI runs or tell you when a pull request just regressed a hot path. That's where CodSpeed comes into play.

Quick Start

The integration works with both Maven and Gradle, see the documentation for details on how to set it up.

Write benchmarks with the standard JMH API:

import org.openjdk.jmh.annotations.Benchmark;

public class FibBenchmark {
  static int fib(int n) {
    return n < 2 ? n : fib(n - 1) + fib(n - 2);
  }

  @Benchmark
  public int benchFib10() {
    return fib(10);
  }
}

Then run them in CI with the CodSpeed Action. For now, only Walltime mode is supported.

- name: Run the benchmarks
  uses: CodSpeedHQ/action@v4
  with:
    mode: walltime
    run: java -jar bench.jar

Benchmarks also run locally using the CodSpeed CLI:

codspeed run --mode walltime -- java -jar bench.jar

For more information, check out the Java documentation and the JMH Benchmark Guide.

Read more

Mar 24, 2026

Ask the Wizard (@codspeedbot) right from GitHub

When a benchmark regresses, the investigation usually starts in a pull request comment, and that's exactly where it should end too. Mention @codspeedbot in any pull request comment, issue comment, or review comment and the Wizard will analyze your performance data, explain what happened, and propose a fix directly in GitHub.

What you can ask

Performance breakdown: get a summary of how a branch affects performance before merging.

@codspeedbot what's the performance impact of this PR?

Explain a regression: the Wizard inspects the flamegraph, identifies the root cause, and writes up a plain-language explanation.

@codspeedbot explain the regression on bench_parse

Propose a fix: the Wizard investigates the regression and opens a pull request with a targeted code change.

@codspeedbot fix the regression on bench_serialize

Add benchmarks: request coverage for a specific function or module and the Wizard will write the benchmarks and open a PR.

@codspeedbot add a benchmark for the parse_config function

Try it

The CodSpeed GitHub App must be installed on your repository. Then drop a comment in any pull request and let the Wizard take it from there.

Learn more in the Wizard documentation.

Read more

Mar 16, 2026

CodSpeed for Agents: MCP Server and Skills

CodSpeed for Agents: MCP Server and Skills

Investigating a regression usually means switching between your editor, the CodSpeed dashboard, and a flamegraph viewer. The CodSpeed MCP server and agent skills bring all of that into your AI assistant, so you can go from "this function is slow" to a fix without leaving your workflow.

MCP Server

The MCP server gives your AI assistant direct access to your performance data through five tools:

  • Query flamegraphs: surface the functions with the highest self time, walk the call tree, and let your assistant cross-reference hot spots with your source code to suggest targeted fixes.
  • Compare runs: generate a full performance report between any two runs, with benchmark-level diffs showing regressions, improvements, and new or missing benchmarks.
  • Get run details: inspect a single run and its benchmark results.
  • List runs: browse recent performance runs with commit, branch, and PR info.
  • List repositories: see all your CodSpeed-enabled repositories.

Agent Skills

Skills teach your assistant how to act on the data. Two skills ship today:

codspeed-optimize: turns your assistant into an autonomous performance engineer. Point it at a slow function or a regression and it loops: measure, analyze the flamegraph, make a targeted change, re-measure, compare, until there is nothing left to gain.

codspeed-setup-harness: handles the initial benchmark setup. It detects your project structure, picks the right framework for your language, writes benchmarks, and verifies everything works. Supports Rust, Python, Node.js, Go, C/C++, and more.

Try it

Install the CodSpeed plugin in Claude Code to get the MCP server and skills in one step:

/plugin marketplace add CodSpeedHQ/codspeed
/plugin install codspeed

Or add the MCP server to any compatible tool separately:

npx add-mcp https://mcp.codspeed.io/mcp --name CodSpeed

And install the agent skills:

npx skills add CodSpeedHQ/codspeed

Then ask your assistant something like:

  • "Make my parse_input function faster."
  • "There's a regression on feat/parser, investigate and fix it."
  • "Add benchmarks to this project."

Learn more about the MCP server and agent skills.

Read more

Jan 23, 2026

Launch Week #2

Introducing CodSpeed CLI: Benchmark Anything

Introducing CodSpeed CLI: Benchmark Anything

Whether you're profiling a Python script, a compiled binary, or a production workload, benchmarking usually means choosing a framework, writing test harnesses, and integrating with language-specific tooling.

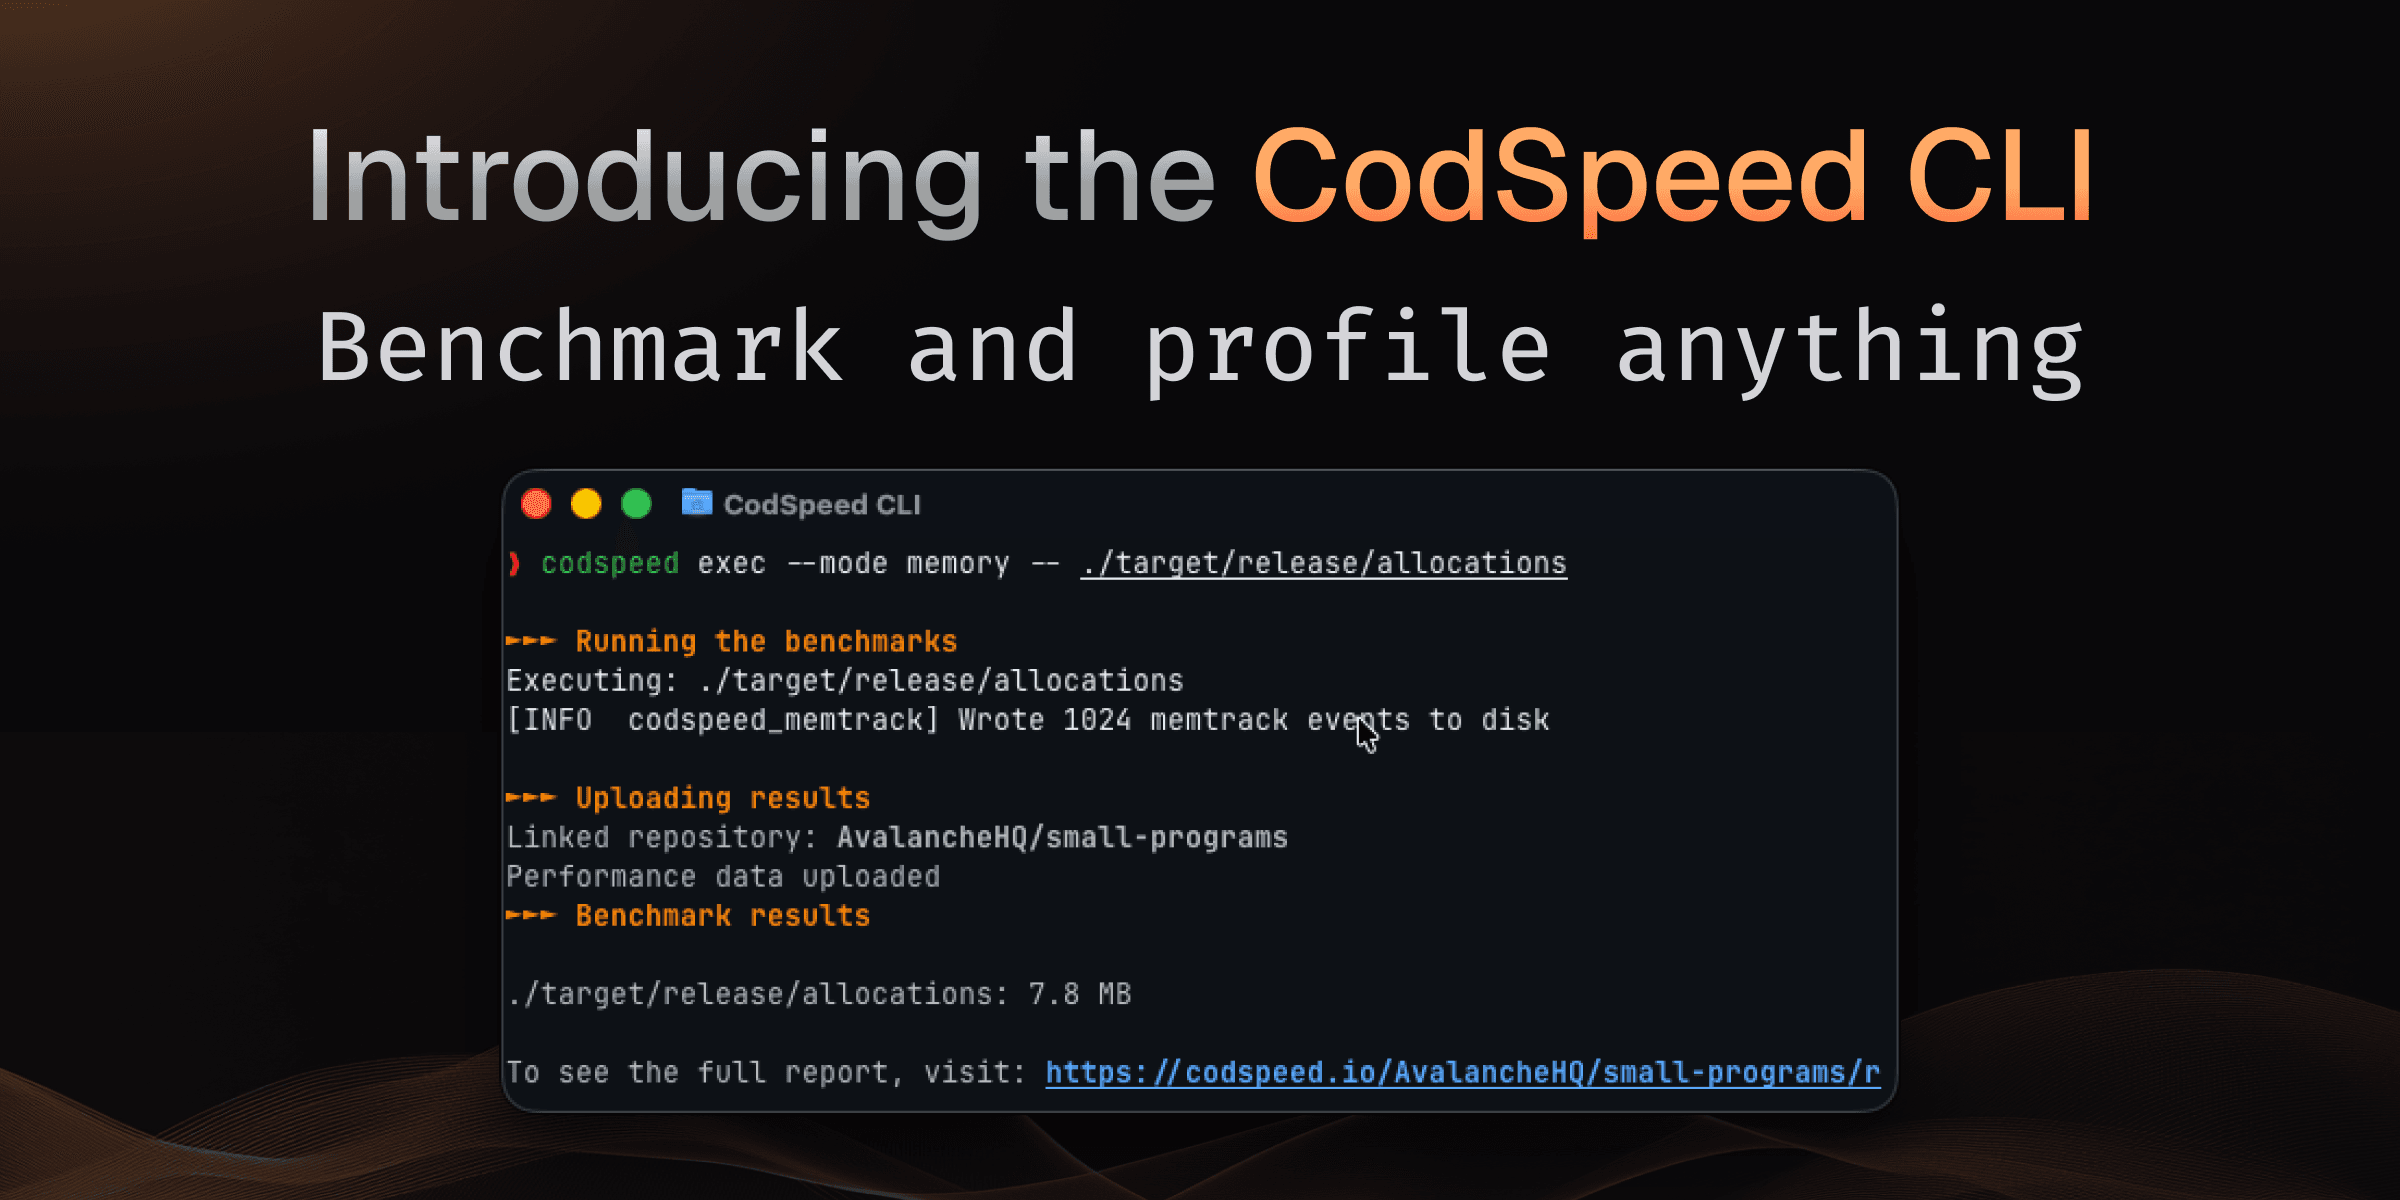
With the CodSpeed CLI, you can benchmark any executable program with a single command no code changes, no framework required. You can benchmark anything.

Benchmark any executable with codspeed exec

How It Works

Run the following commands to benchmark any program directly:

# Benchmark a binary
codspeed exec --mode memory -- ./my-binary --arg1 value

# Benchmark a script
codspeed exec --mode simulation -- python my_script.py

# Benchmark with specific config
codspeed exec --mode walltime --max-rounds 100 -- node app.js

No code changes needed. CodSpeed wraps your program, measures performance, and provides instrument results automatically.

Three Measurement Instruments

Choose the right instrument for your use case:

Simulation Mode: CPU simulation for <1% variance and hardware-independent measurements. Perfect for catching regressions in CI.

Walltime Mode: Real-world execution time including I/O, network, and system effects. Ideal for end-to-end performance testing.

Memory Mode: Heap allocation tracking to identify memory bottlenecks and optimize resource usage.

Config-Based Benchmarking with codspeed run

To keep benchmarks versioned alongside your code, and be able to run them easily locally or in CI, define them in a codspeed.yml file:

benchmarks:
  - name: "JSON parsing"
    run: "./parse-json input.json"
    mode: simulation

  - name: "API response time"
    run: "python fetch_users.py"
    mode: walltime
    warmup: 3
    min_time: 10s

  - name: "Data processing pipeline"
    run: "./process-data --input large.csv"
    mode: memory

Then execute with:

codspeed run -m walltime

Open Source and Available Now

The entire CodSpeed CLI is now open source. Check out the code, contribute, and adapt it to your workflow:

CodSpeedHQ/codspeed

Installation is a single command:

curl -fsSL https://codspeed.io/install.sh | bash

Try It Yourself

Start benchmarking any executable today. Install the CLI, run codspeed exec on your program, and see detailed performance results in your dashboard.

Give us a star on GitHub if you find it useful, and check out the CLI documentation to learn more about configuration options, instruments, and language integrations.

Read more

Jan 22, 2026

Launch Week #2

Search and Filter Benchmarks

Search and Filter Benchmarks

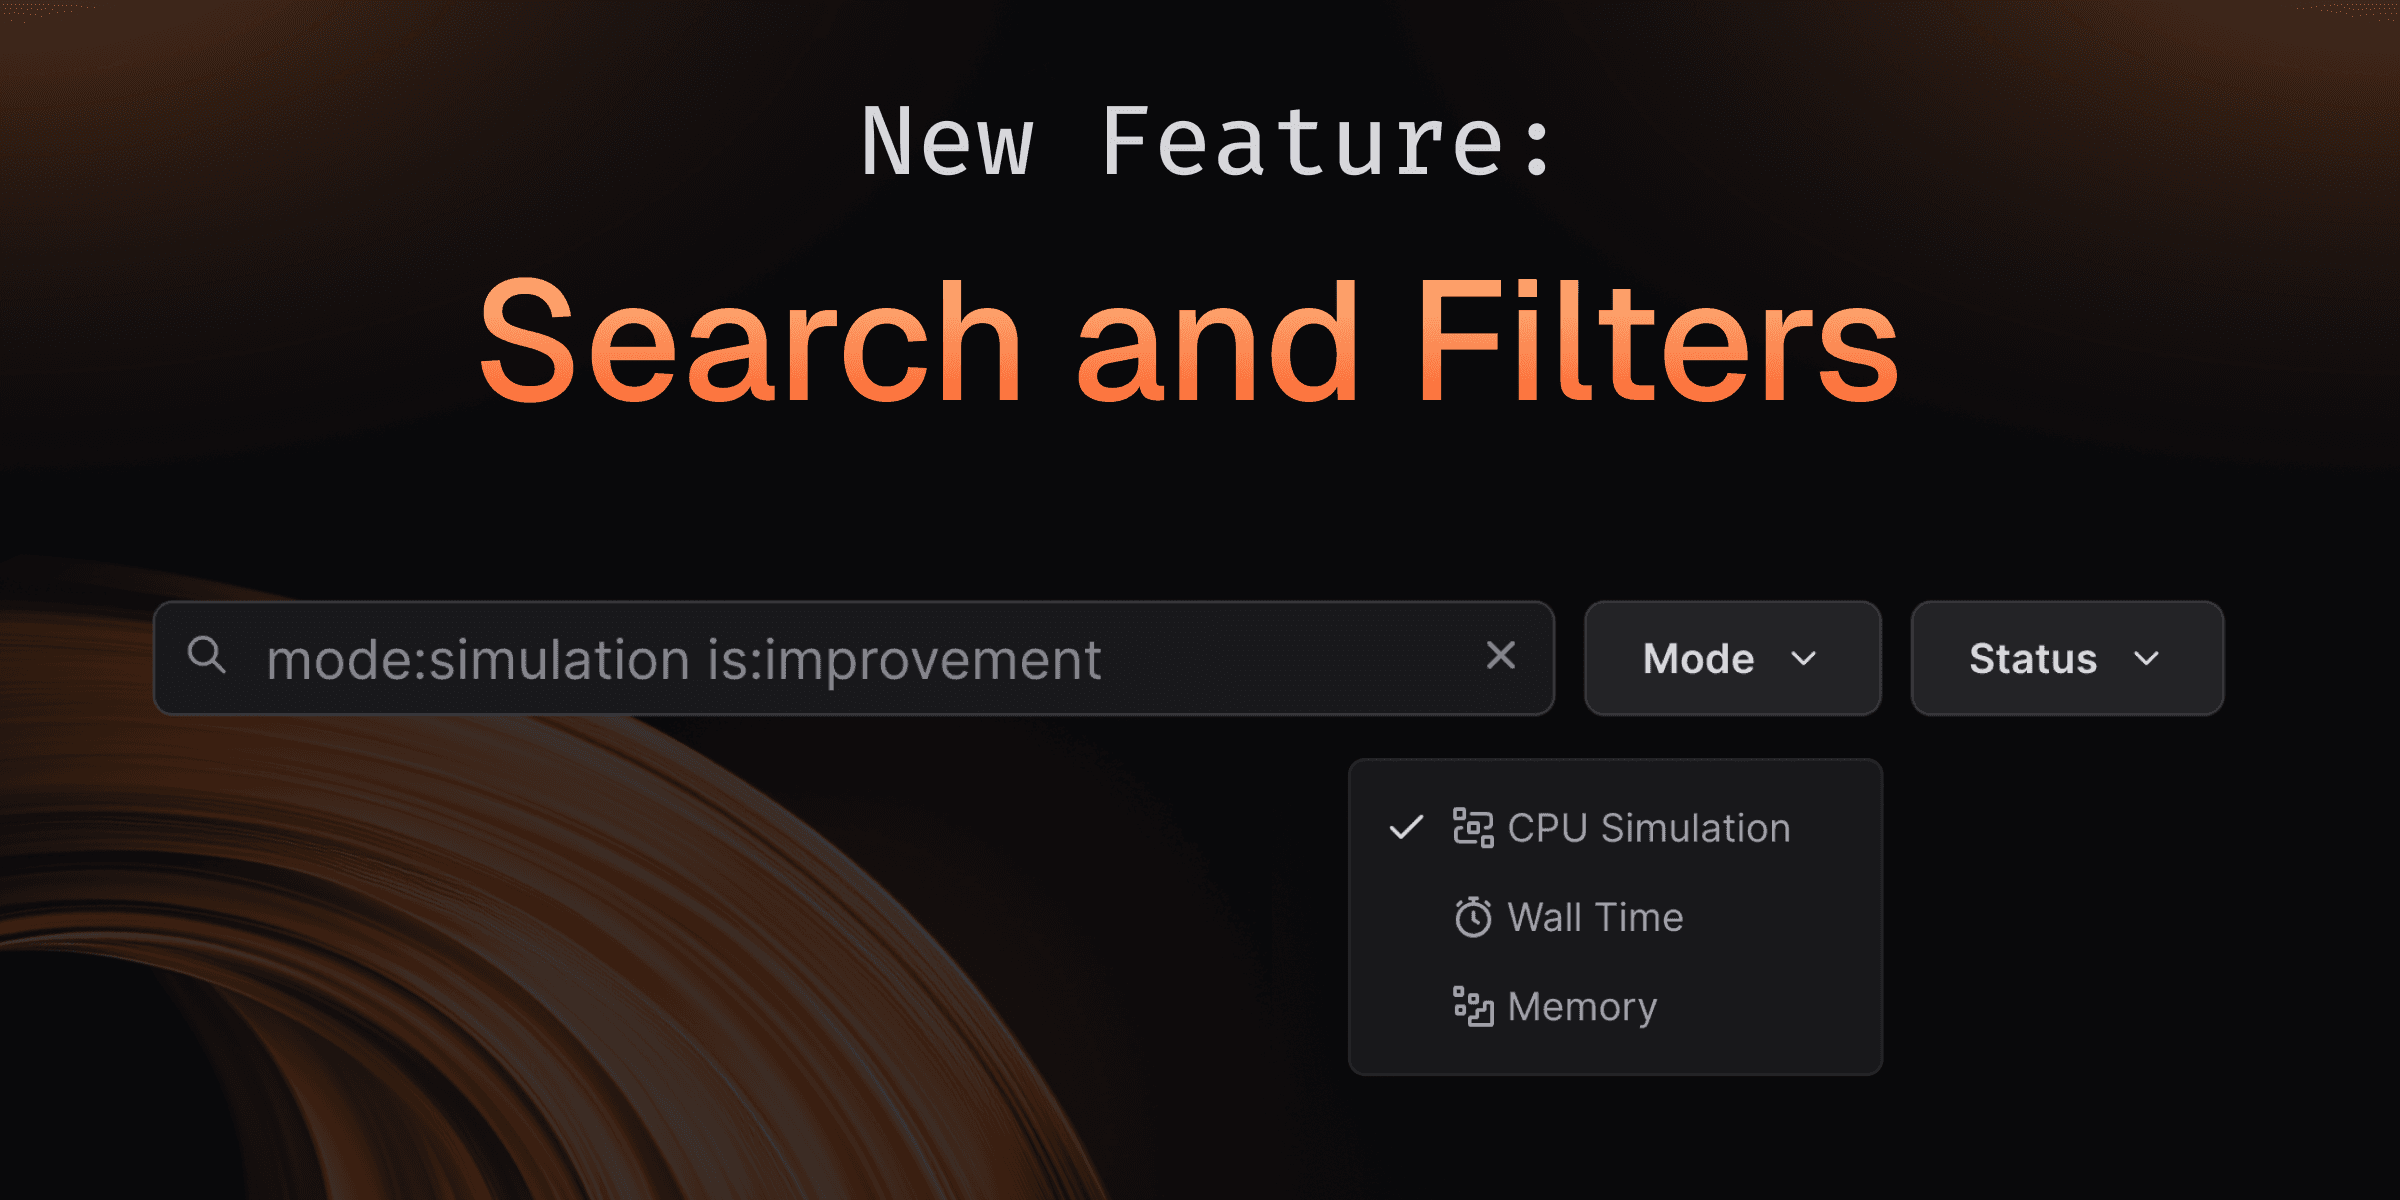
Finding the right benchmark in a repository with thousands of results and multiple instruments used to mean endless scrolling. With Search and Filtering, you can instantly navigate benchmark suites of any size—whether you have 10 or 10,000 benchmarks using powerful GitHub-style filters, text search, and smart pagination that keeps everything fast and responsive.

Search and filter through thousands of benchmarks instantly

How It Works

Use the search bar on any branch, comparison, or run page to quickly filter benchmarks.

Text search

Type any part of a benchmark name or path. Multiple space-separated terms work as AND filters to narrow results further.

Status filters

Use is: syntax to filter by benchmark state:

  • is:regression - Show performance regressions
  • is:improvement - Show performance improvements
  • is:archived - Show archived benchmarks
  • is:ignored - Show ignored benchmarks
  • is:skipped - Show skipped benchmarks
  • is:new - Show newly added benchmarks
  • is:untouched - Show unchanged benchmarks

Mode filters

Filter by instrumentation mode:

  • mode:simulation - Show only simulation mode results
  • mode:walltime - Show only walltime mode results
  • mode:memory - Show only memory mode results

Combine filters

For example,

is:regression mode:simulation optimize

finds all regressions in simulation mode with "optimize" in the name or path.

Try It Yourself

Search and filtering is available now on all your benchmark pages. Try it on your next benchmark run—search for specific tests, filter by performance changes, or explore archived benchmarks with zero lag!

Read more

Jan 21, 2026

Launch Week #2

Meet the Memory Instrument: Track Memory Consumption Too

Meet the Memory Instrument: Track Memory Consumption Too

Performance isn't just about execution time—memory consumption matters just as much. Memory leaks, excessive allocations, and growing peak usage can silently degrade performance or cause unexpected behavior in production.

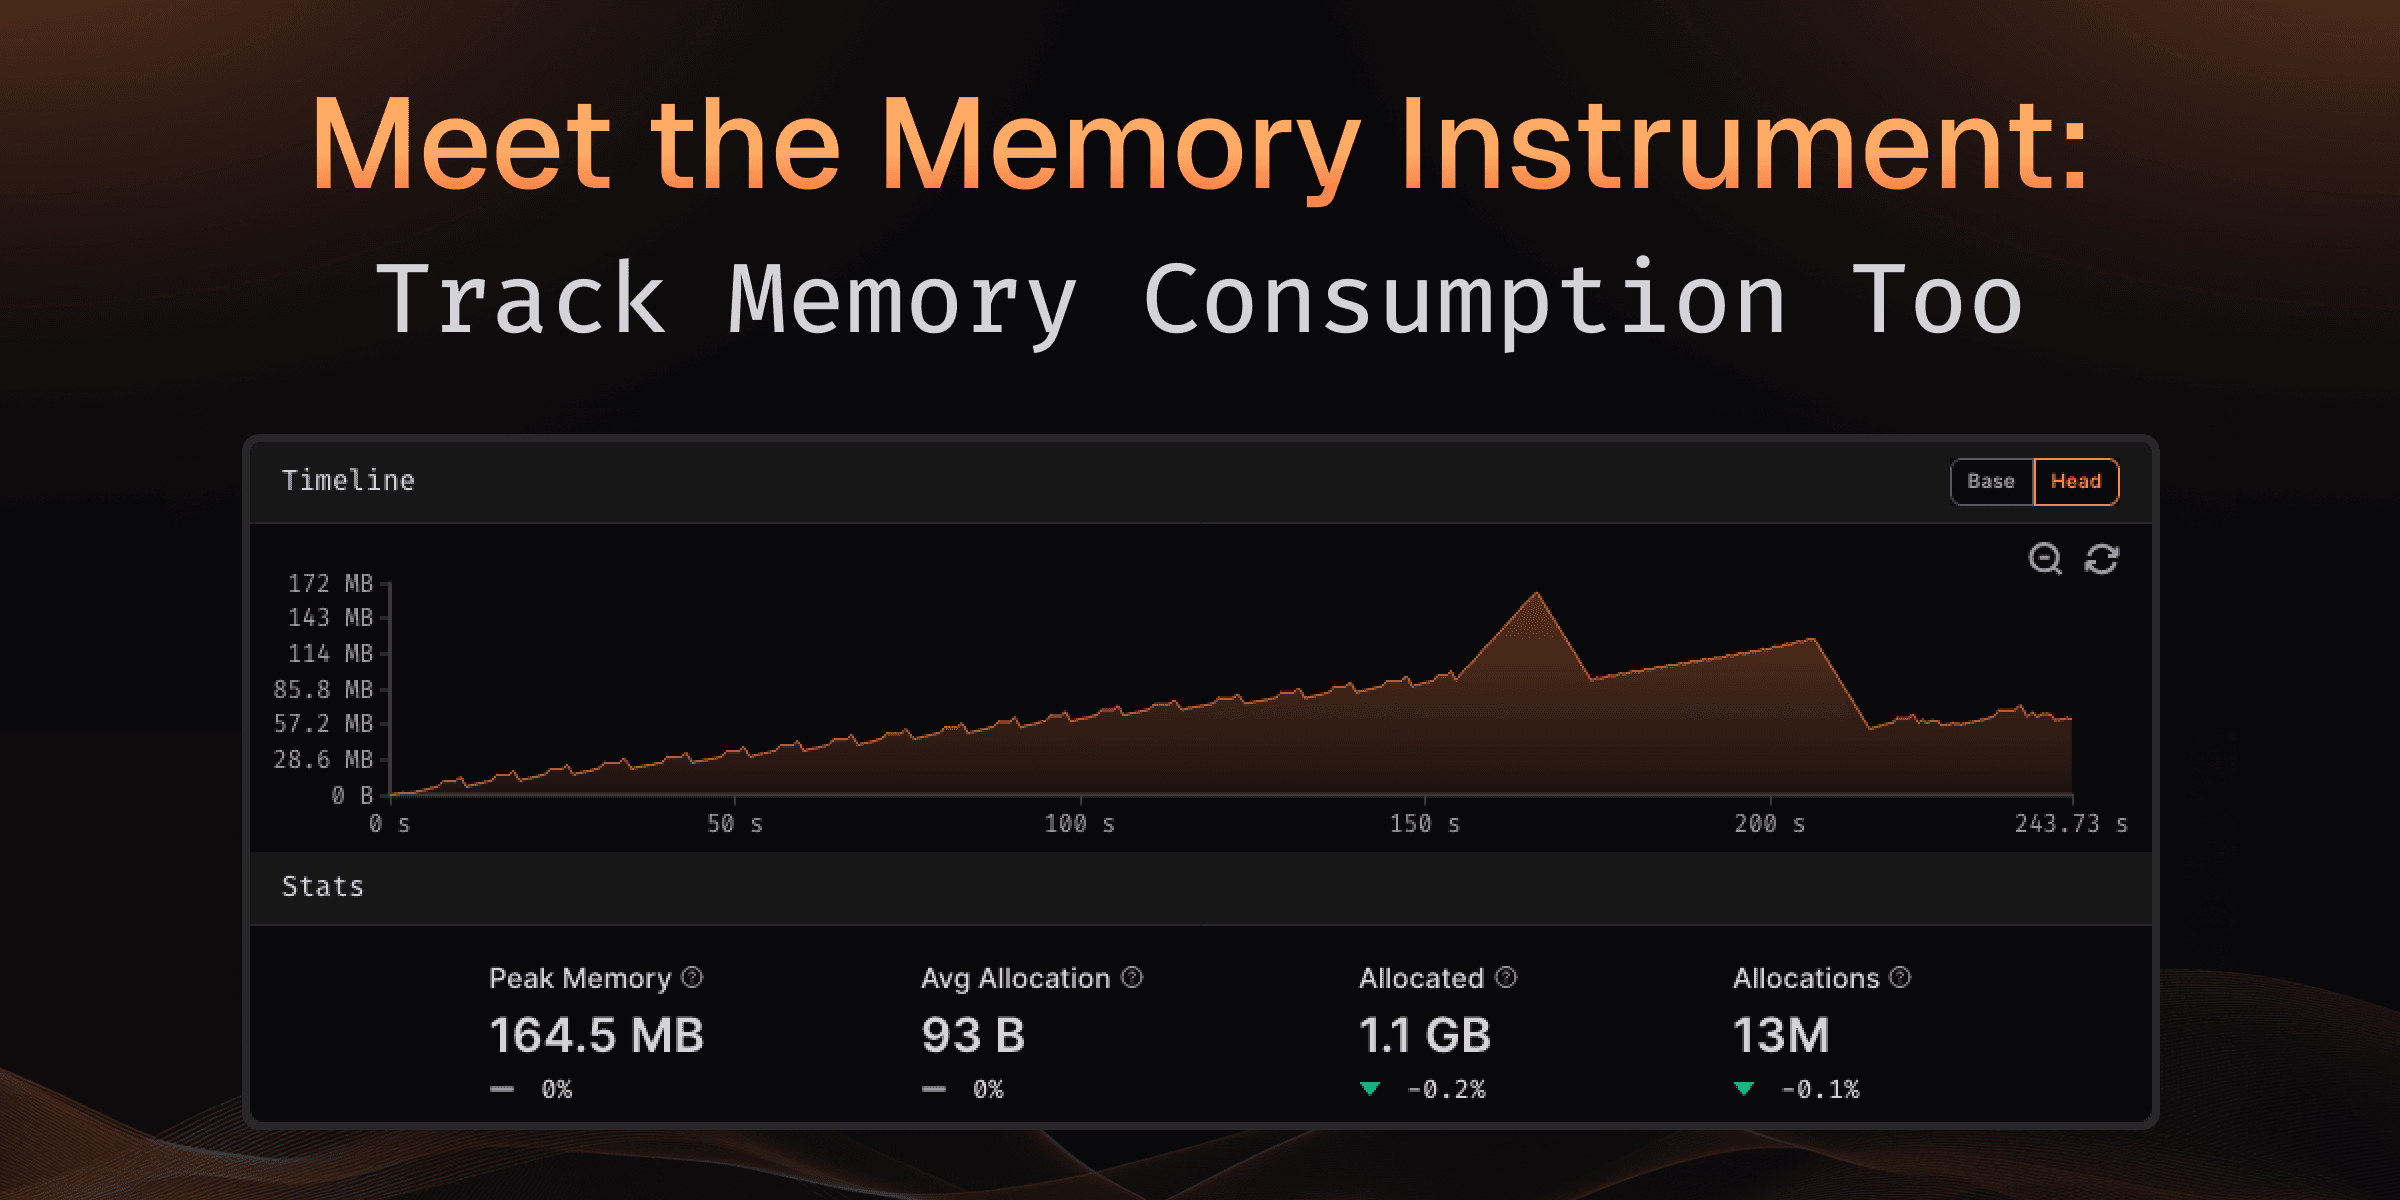
The new Memory Instrument automatically tracks memory allocations, deallocations, and peak consumption during every benchmark run, helping you identify memory bottlenecks before they become problems.

Demo of the Memory Instrument tracking allocations and peak memory usage

What You Get

Every memory-instrumented benchmark run now includes comprehensive memory metrics that help you understand allocation behavior:

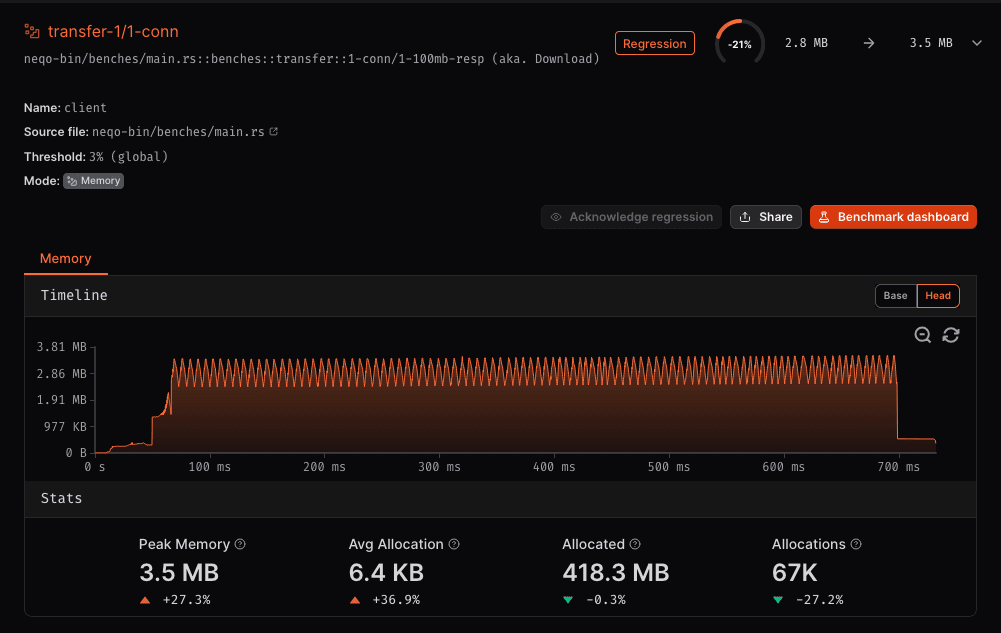
Memory timeline graph showing allocation patterns

Timeline showing allocation and deallocation patterns throughout execution

Memory Statistics

  • Peak Memory: Maximum memory consumed during benchmark execution
  • Average Allocation Size: Mean size of individual memory allocations
  • Total Allocated: Cumulative memory allocated throughout execution
  • Total Allocations: Number of allocation operations performed

All metrics show comparison between baseline and current runs, with clear indicators of whether memory usage increased or decreased.

Memory Timeline Visualization

The timeline graph shows exactly how memory consumption changes throughout your benchmark:

  • Real-time tracking: See memory allocations and deallocations as they happen
  • Peak identification: Quickly spot when and where peak memory occurs
  • Zoom and pan: Navigate through the timeline to examine specific periods

Finding Memory Issues

The Memory Instrument helps you identify common memory problems:

  • Growing peak memory between runs? You may have introduced a memory leak or increased working set size
  • High number of allocations? Consider object pooling or reducing temporary allocations
  • Large average allocation size? Review whether you're allocating more memory than necessary
  • Spiky timeline pattern? Your code may benefit from pre-allocation or memory reuse strategies

What's Coming Next?

We're continuing to expand memory analysis capabilities:

  • Memory leak detection: Automatic identification of memory that wasn't freed
  • Allocation hotspots: Flame graphs showing which functions allocate the most memory
  • Garbage collection metrics: Track the impact of GC on memory usage and performance

The Memory Instrument gives you the visibility you need to write memory-efficient code with confidence.

Try It Now

Simply configure your workflow to use the memory runner:

- uses: CodSpeedHQ/action@v4
  with:
    runner: memory # Enable memory instrumentation 

Memory instrumentation is available on all runners now for Rust and C/C++ benchmarks, with more languages coming soon.

Learn more about the Memory Instrument.

Read more

We handle performance, so you can focus on shipping.

Talk to our team about deployment, security, and scale; or start building today.