How does it work?
CodSpeed builds your benchmarks to run only once while measuring the memory. The profiling is done using a custom eBPF program ensuring stability and minimal overhead (depending on how allocation-heavy the benchmark is). The tracking is done by either instrumenting the dynamically loaded allocator libraries or your benchmark executable (when using a statically linked allocator). We track all allocation related functions (e.g.malloc, free,
…) in your benchmark.
What does it measure?
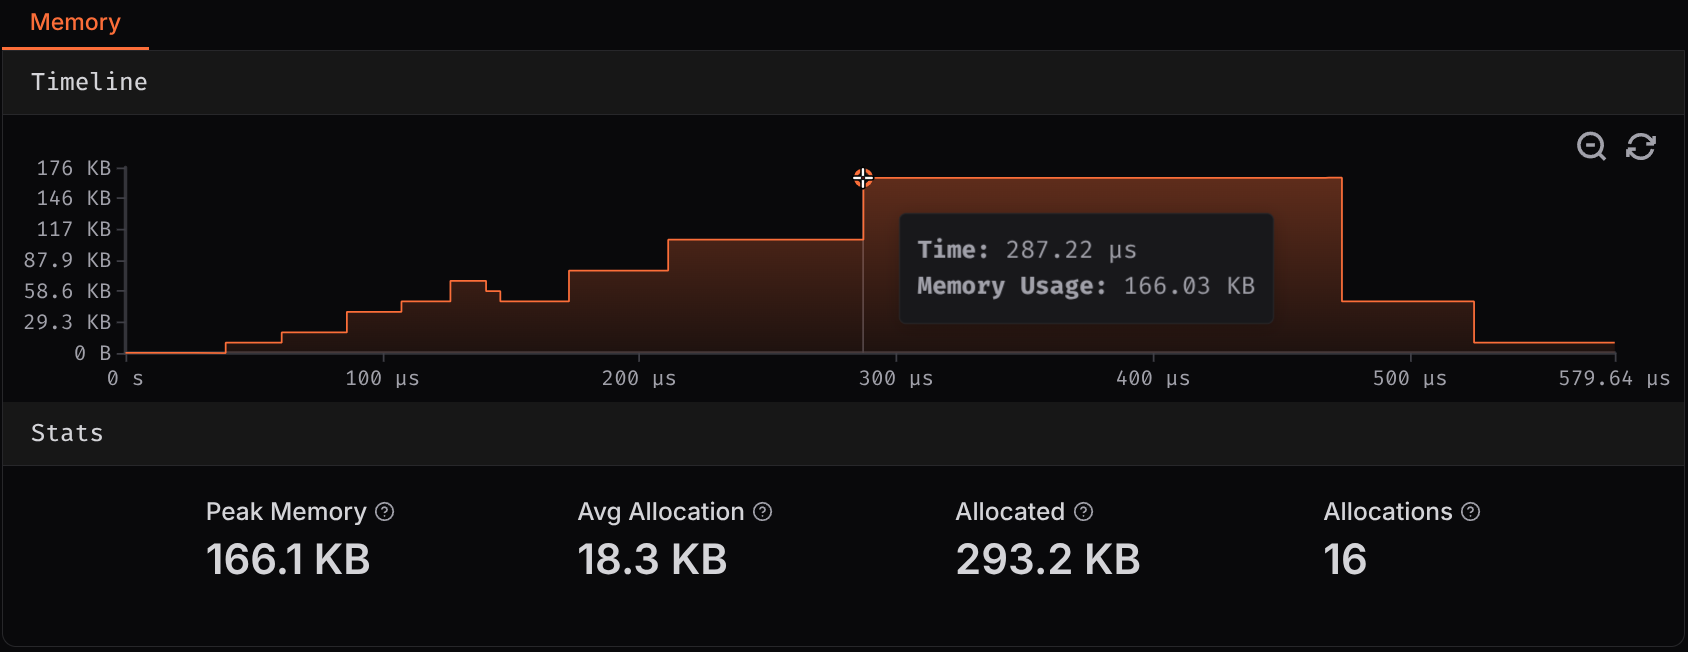
Memory run of a benchmark
- Peak Memory Usage: The maximum memory consumed at any single point during execution. This determines the minimum RAM requirements for your application and helps prevent out-of-memory errors on constrained systems or expensive swapping.
- Average Allocation Size: The average size of each heap allocation. Smaller allocations can lead to better cache locality and less memory fragmentation.
- Total Allocations: The total amount of heap memory allocated throughout your benchmark execution. Fewer heap allocations typically mean better cache locality and less pressure on the memory allocator, making this a key optimization target for performance-critical code.
- Allocation Count: The number of individual allocation operations performed during the benchmark. Since each allocation has overhead, high allocation counts can indicate excessive temporary object creation, impacting both performance and memory fragmentation.
-
Memory Usage Over Time: The timeline shows how the peak memory evolves
throughout benchmark execution. This graph reveals memory patterns, like
steady-state behavior, gradual growth, or periodic spikes.
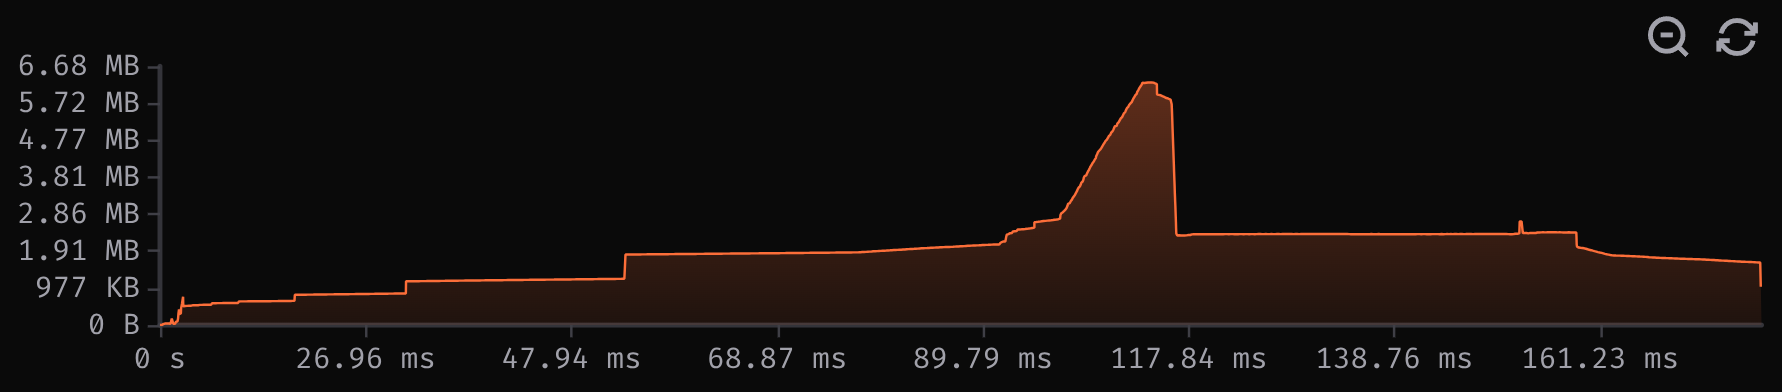
Memory usage over time
Usage with GitHub Actions
Requirements:CodSpeedHQ/action >= 4- A supported benchmark framework (see Language Support)
mode: memory in the
CodSpeed Action configuration:
The CodSpeed action will automatically:
- Instrument your benchmarks to capture memory metrics
- Run your benchmarks once with memory tracking enabled
- Upload results to the CodSpeed dashboard
Compatibility
Language Support
Memory is currently available for:- Rust
- C++:
codspeed-google-benchmark >= 2.1.0 - Python:
pytest-codspeed >= 4.3.0 - Node.js
Supported Allocators
CodSpeed supports both dynamic and statically linked allocators. This is achieved by locating the libraries on your system in common paths, or by detecting allocator functions inside your benchmark binary. However, this means that if your allocator or benchmark binary is in a non-standard path, memory profiling can fail. Currently, we support the following allocators: We’re planning to extend this list. If an allocator is missing, feel free to open an issue or contact us.Limitations
- Instrumentation overhead: The memory instrument tracks every individual allocation, which works best for small benchmarks with <2M allocations. For bigger benchmarks, try splitting the input or benchmark into smaller parts.
- Multi-threaded variance: Concurrent threads can allocate in non-deterministic order, causing allocation counts and peak memory to vary between runs.
- Spawned sub-processes: Allocations in spawned sub-processes are only tracked with dynamically linked allocators. Statically linked allocators (e.g. jemalloc in Rust) are not supported.
Best Practices
To get the most out of memory, consider these recommendations:- Run benchmarks with realistic workloads - Use production-representative data sizes and patterns to capture actual memory behavior rather than toy examples
- Focus optimization on hot paths - Prioritize reducing allocations in frequently called code, as allocation count in hot paths can significantly impact both memory and CPU performance
- Combine with CPU profiling - Memory and CPU metrics together reveal the full performance story; high allocation counts often correlate with CPU overhead
- Track trends over time - Compare memory metrics across benchmark runs to catch regressions early and validate that optimizations remain effective as code evolves
Next Steps
CPU Simulation
Learn about CodSpeed’s CPU simulation instrument for performance measurement
Creating Benchmarks
Learn how to write effective benchmarks for your code
Profiling
Explore automated profiling features for deeper performance insights
GitHub Actions Setup
Complete guide to setting up CodSpeed with GitHub Actions