Benchmark performance impact
The performance impact denotes an improvement or regression in performance of a benchmark. It is calculated by comparing the benchmark time measurement of the head commit with the time measurement of the base commit. A negative performance metric means that the benchmark is slower than the previous commit. The closer its value is to-1, the slower it is.
A positive performance metric means
that the benchmark is faster than the previous commit. Its value can go up to
to denote massive speed improvements.
Naturally, when the benchmark is as fast as the previous commit, the performance
metric is .
Regression threshold
On the settings page of a project, you can set a threshold for a regression to be considered a regression. By default, this value is set to10% (which is
equivalent to 0.1). The value can be set from 0% to 50% by an admin of the
project. More information about setting the threshold can be found in the
customization documentation.
Individual benchmarks can have their own custom regression thresholds that
override the project-level setting. See the
customization documentation
for details on configuring per-benchmark thresholds.
Commit performance impact
To get the overall performance impact of a commit, we take the geometric mean of the benchmarks whose change exceeds their regression threshold (the “changed” benchmarks). In that case, benchmarks within the threshold are not taken into account. Let be the number of changed benchmarks and their list of impacts.For example, with impactsIf no benchmark exceeds its threshold, we fall back to the geometric mean of all benchmarks.[0.3, 0.3, 0.3, -0.11]and a threshold of0.1, all four benchmarks exceed their threshold, so the overall commit impact is approximately+0.20.
The overall commit impact reflects the aggregate story of the run. Regressions
above threshold are surfaced independently of this number: they are listed
in the report, trigger the performance status check to fail, and are flagged in
the pull request comment — even when the overall impact is positive.
We use the geometric mean rather than the arithmetic mean because it is less
sensitive to outliers and composes the way relative performance changes
naturally do.
Baseline report selection
To create a performance impact, we need to compare the execution speed of the benchmarks against a baseline of those benchmarks’ execution speed. Depending on the context of the run, the baseline report can be different.A baseline only exists if the base branch (usually your default branch, e.g.,
main) already has CodSpeed runs. Run CodSpeed on push to your default branch
so every commit there is benchmarked. If CodSpeed runs only on pull_request,
there is nothing on the default branch to compare against, and pull requests
show no performance impact.Pull Request
When triggering a CodSpeed run on a pull request between ahead branch and a
base branch, the baseline report will be the report of the latest commit of
the base branch with a CodSpeed run.
Checked-out commit of a Pull Request in GitHub ActionsBy default, when using the
action/checkout in GitHub Actions, the
checked-out commit of a pull request will be the
merge commit
of the pull request. This means that GitHub will create a merge commit M
between the base branch and the head branch, and use it as the checked-out
commit.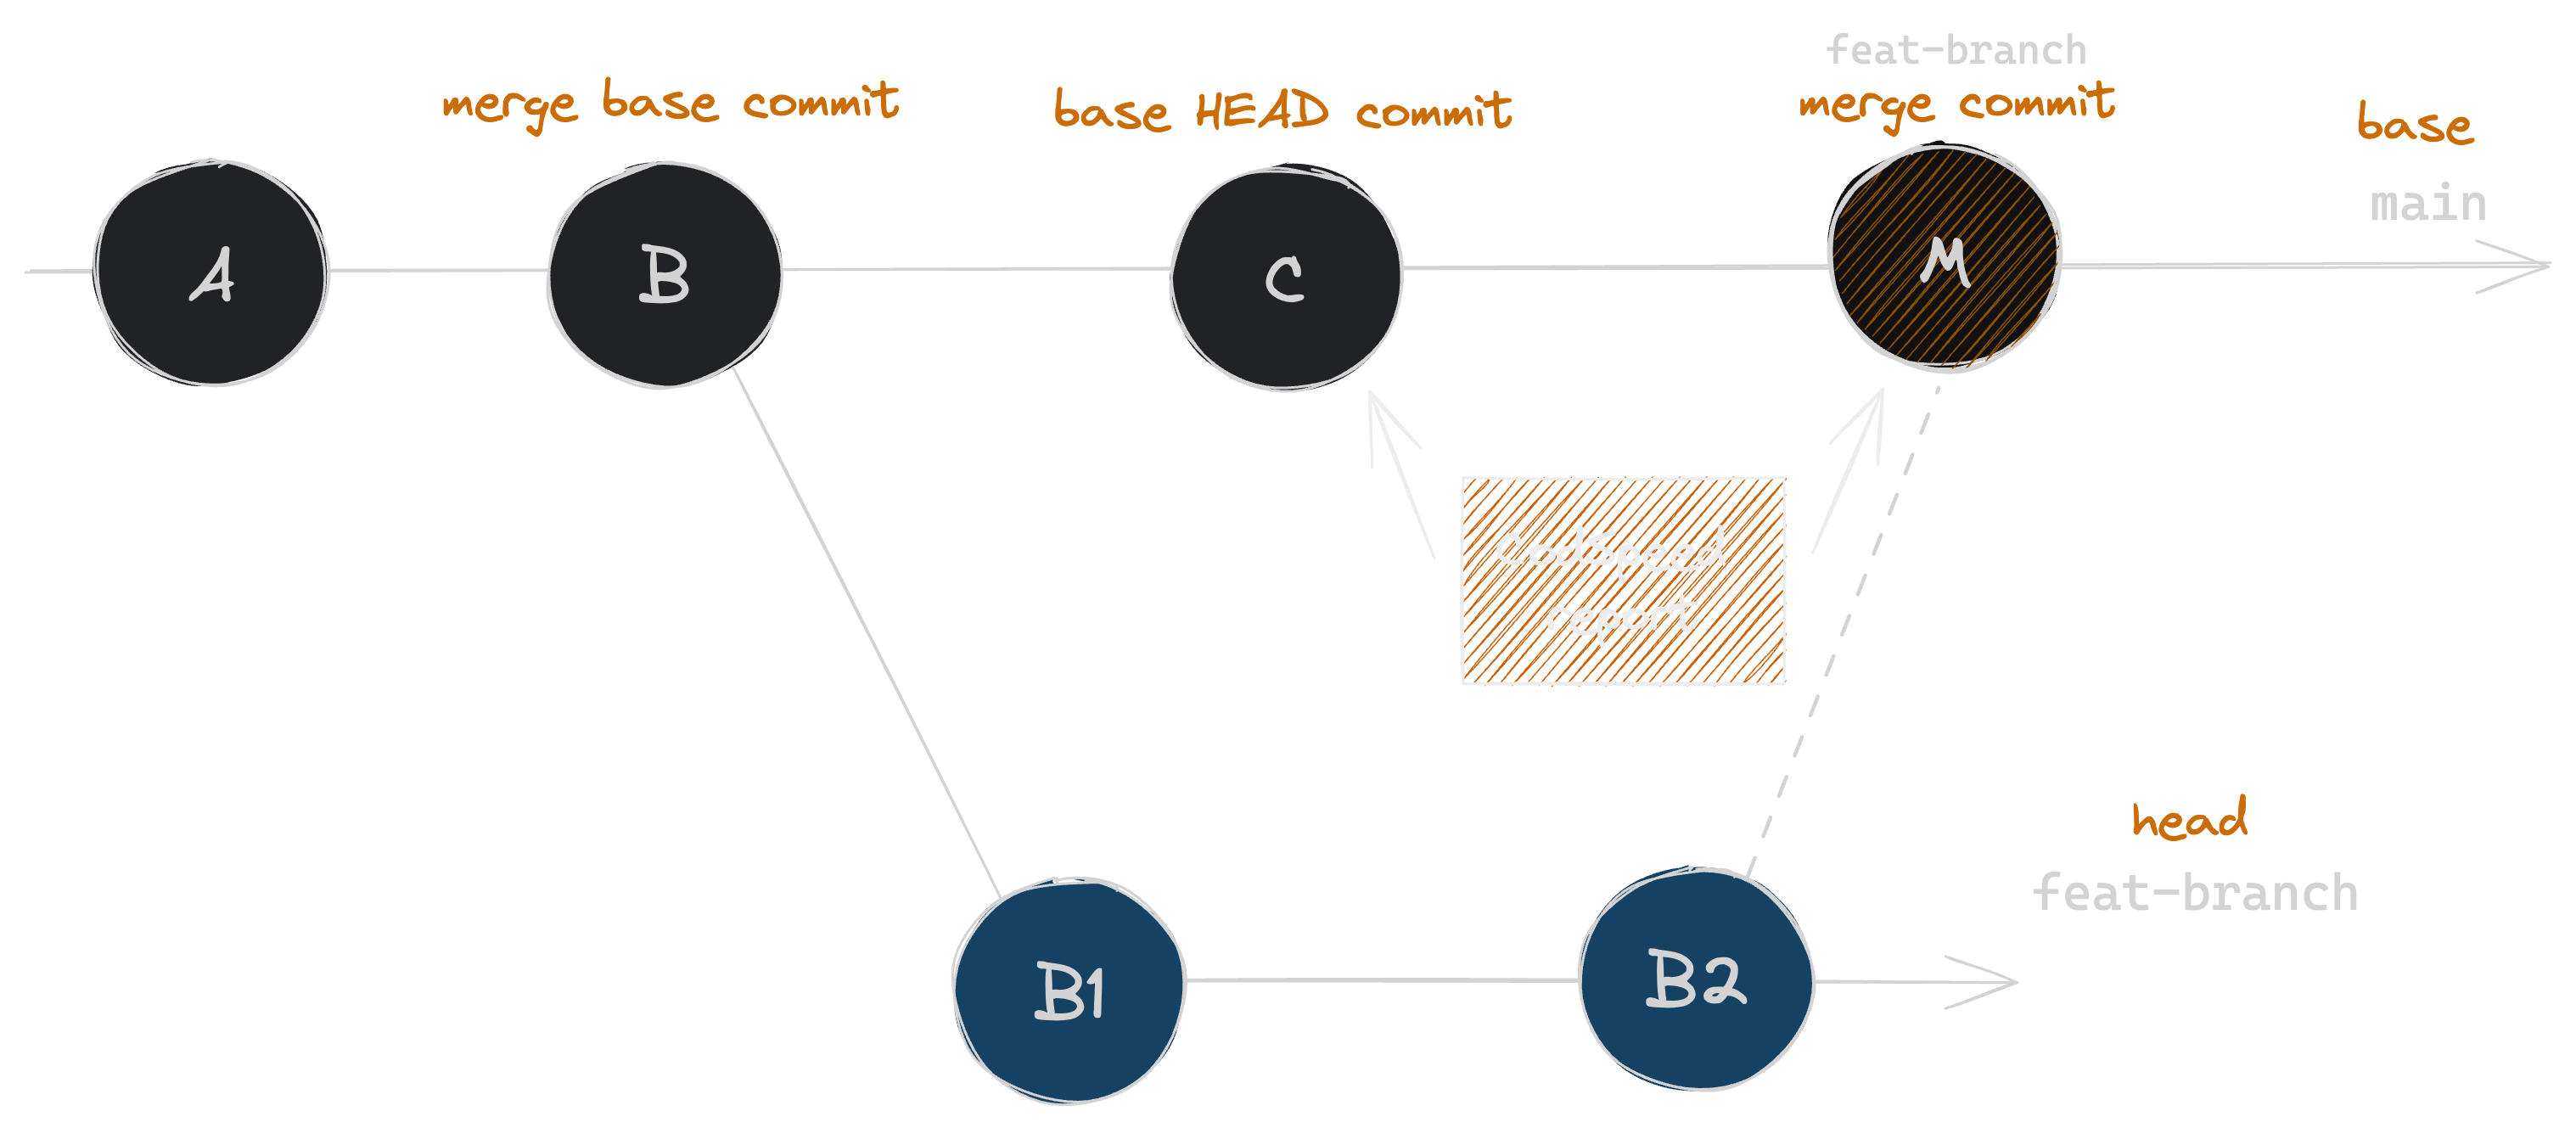
HEAD commit C of the base
branch and the merge commit M. The report will thus only include the changes
of commits B1 and B2.
Every time a new commit is pushed on the
feat-branch, the baseline report will
be updated to the latest commit of the base branch with a CodSpeed run.Branch
When triggering a CodSpeed run following a push on a branch, the baseline report will be the report of the closest commit of the branch.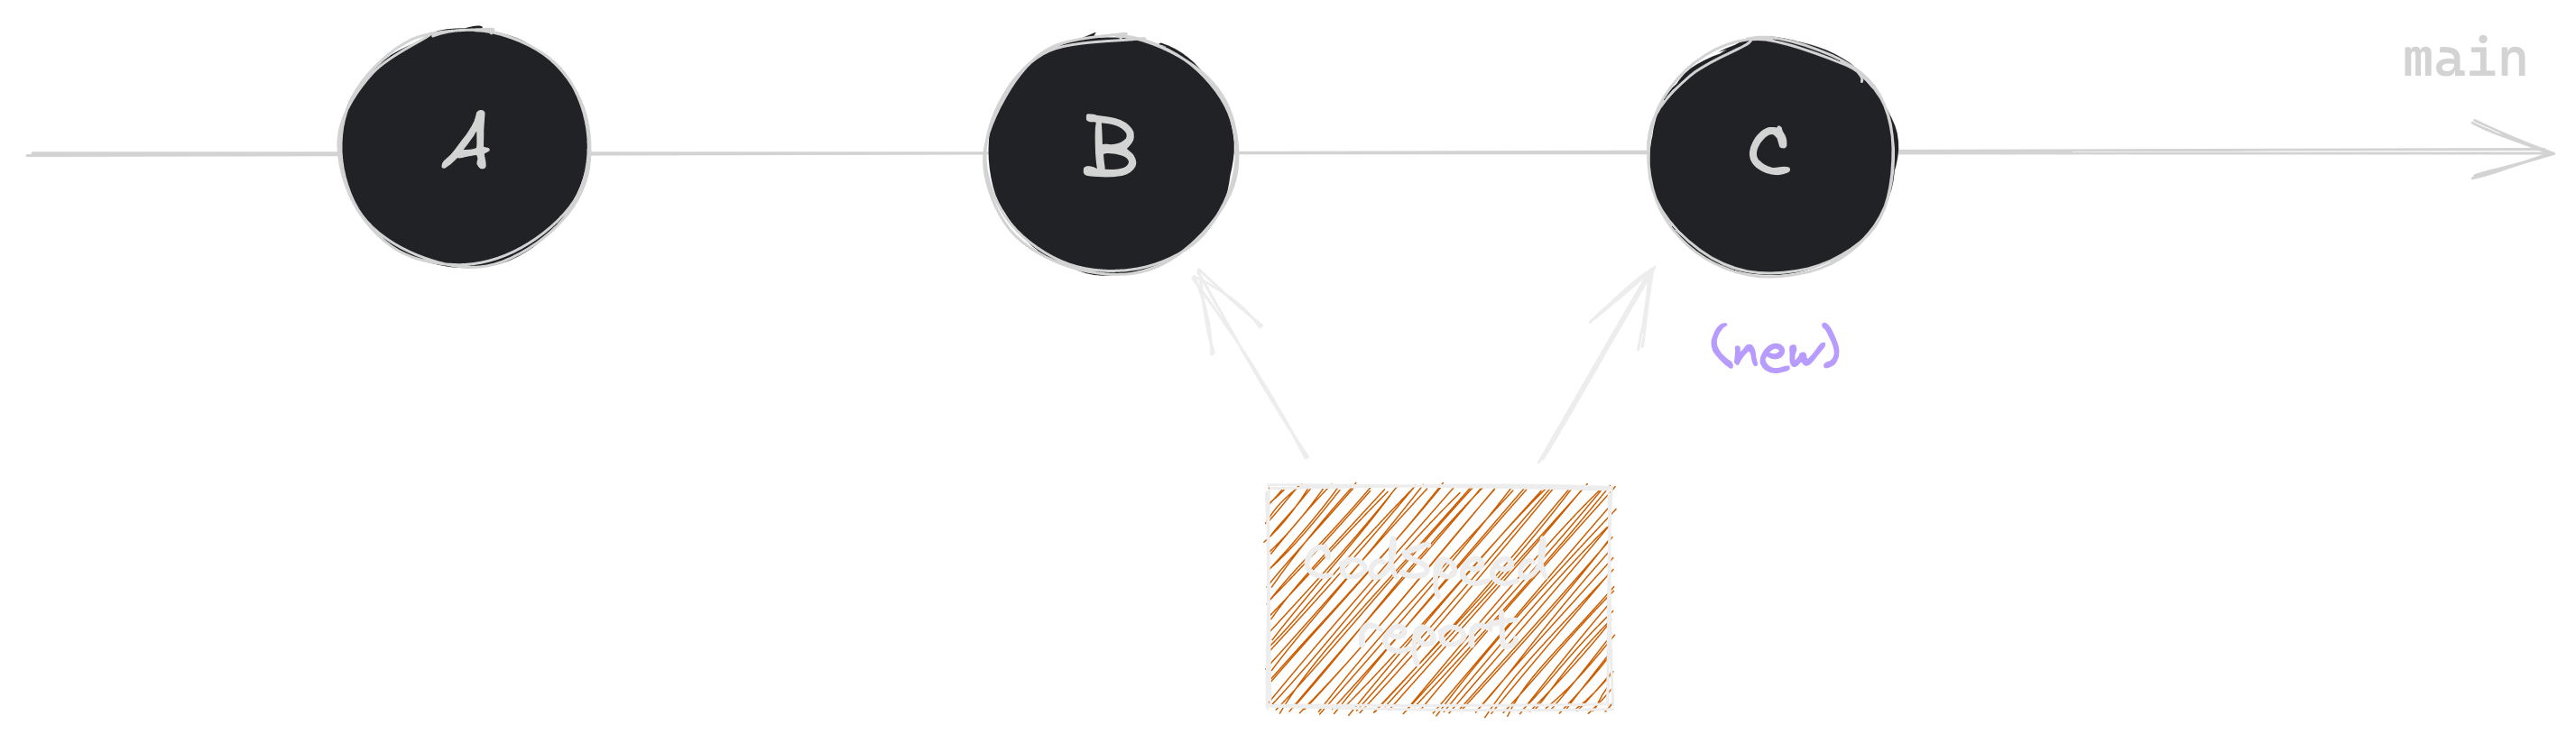
In this example, a report already exists for the commit B of the
main
branch. A new commit C is pushed on the main branch. The baseline report
for C will be the report of the commit B.Performance impact Gauge
The performance impact gauge is a visual representation of the performance impact, displayed in multiple places of the CodSpeed UI. Some examples of the gauge with their corresponding impact values: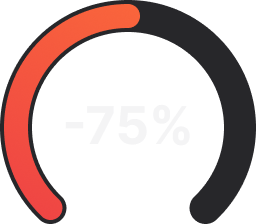
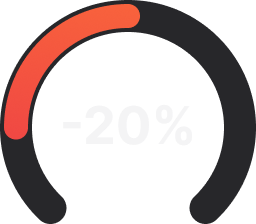

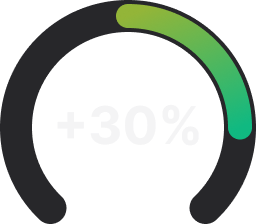
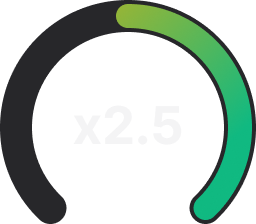
To make it easier to spot regressions and improvements, the mapping between the
actual performance impact value and the gauge is not linear.
Next Steps
Set Up Automated Performance Checks
Configure GitHub branch protection to automatically block performance
regressions
Debug Performance Issues
Use flame graphs and profiling data to identify and fix bottlenecks
Customize Regression Thresholds
Fine-tune regression sensitivity for your project’s requirements
Create Comprehensive Benchmarks
Build a robust benchmark suite to catch performance issues early