Continuous performance testing directly in your workflow

Automatically run benchmarks in your CI, detect regressions, and get actionable insights directly in every pull request.
 ProfilingMemoryWall timeQueries


Ship fast. We’ll catch what slows you down.
Step 1
Connect your repository
Install CodSpeed in your CI and plug into your existing benchmark setup.
Already have benchmarks?
Just point CodSpeed to your existing benchmark suite, whether you’re using pytest-benchmark, Criterion, Vitest Bench, or something else. We’ll instrument it in place, so there’s nothing to rewrite.
Catch regressions early
Before they reach production
0 manual benchmarking
Fully automated profiling
Reliable metrics
Low-noise, reproducible results
Actionable insights
Pinpoint exactly what got slower

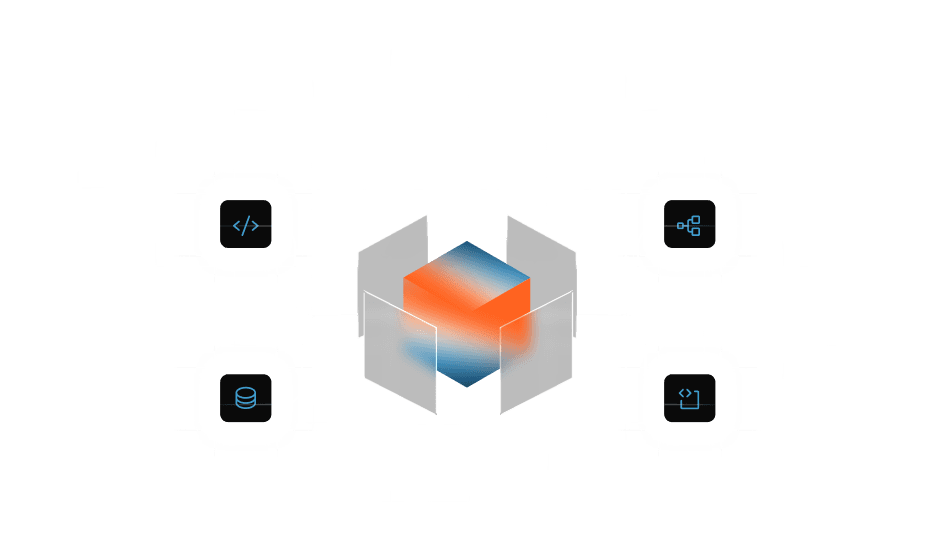
Step 1
Connect your repository
Install CodSpeed in your CI and plug into your existing benchmark setup.
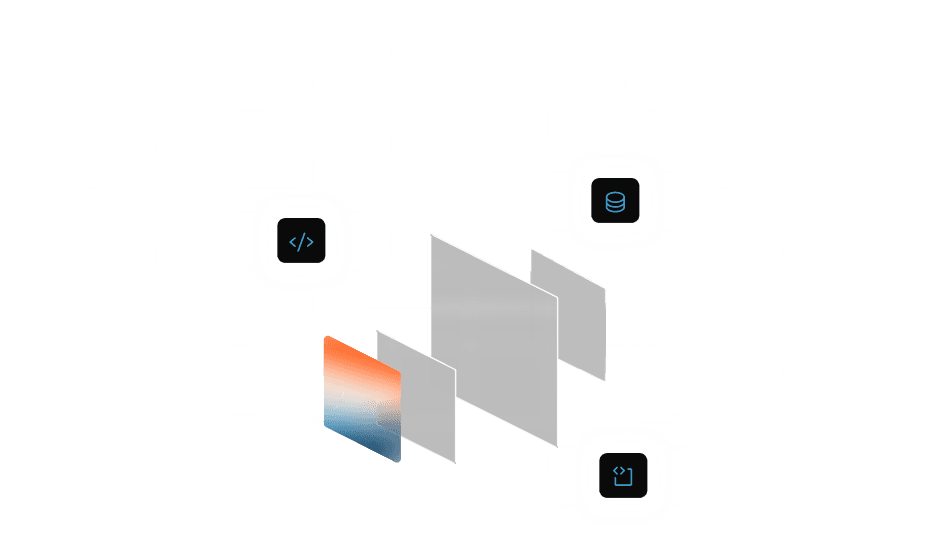
Step 2
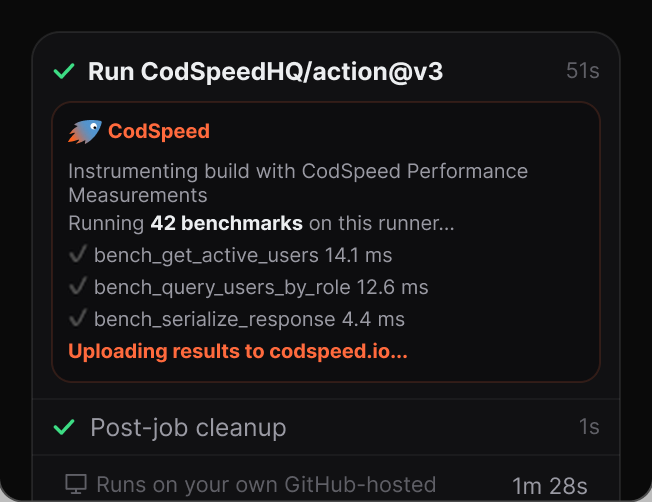
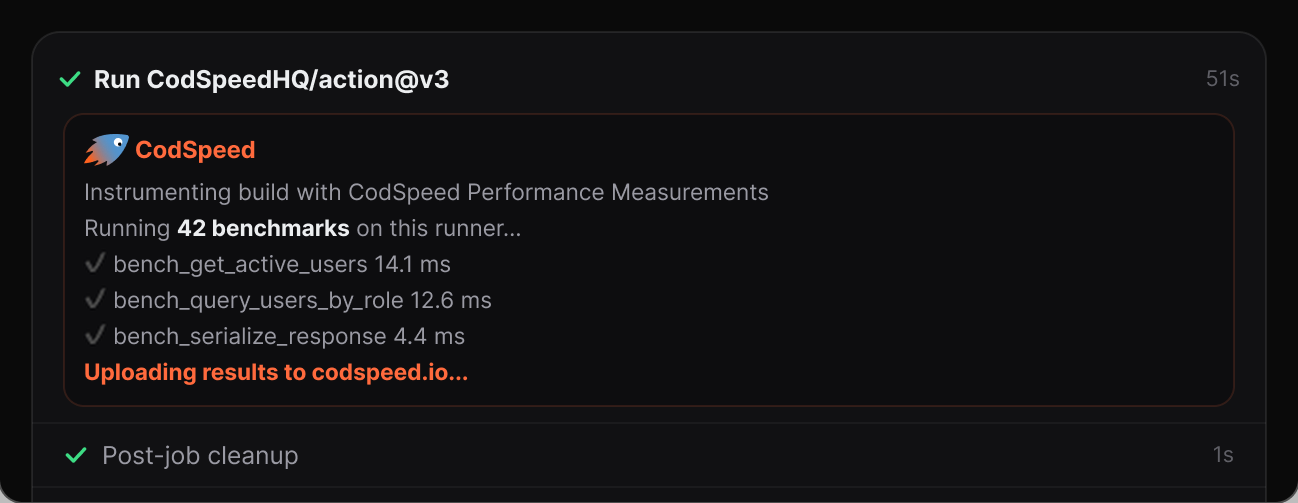
Run reliable benchmarks
CodSpeed instruments your code to generate stable, noise-free performance data in your CI pipeline.
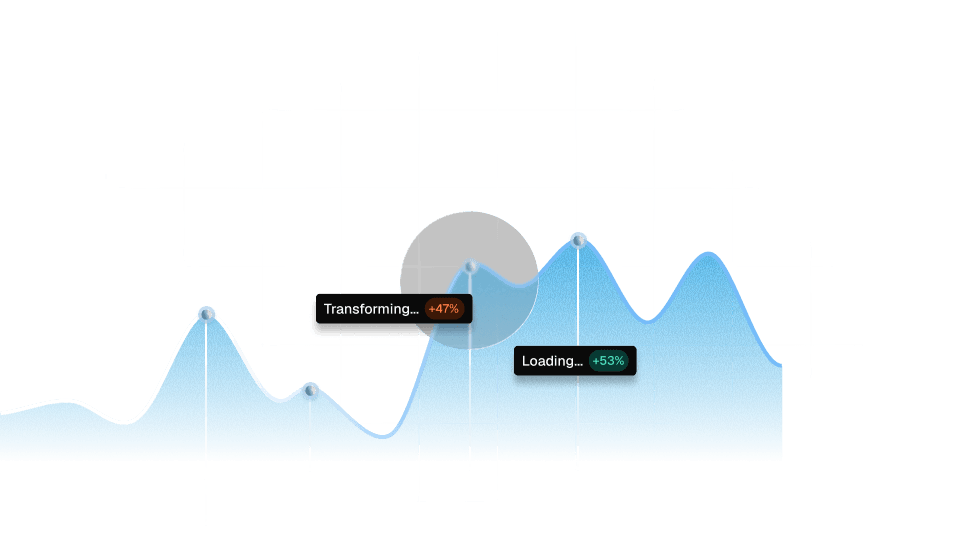
Step 3
Analyze performance automatically
Raw benchmark results are automatically processed into clean reports and flamegraphs.
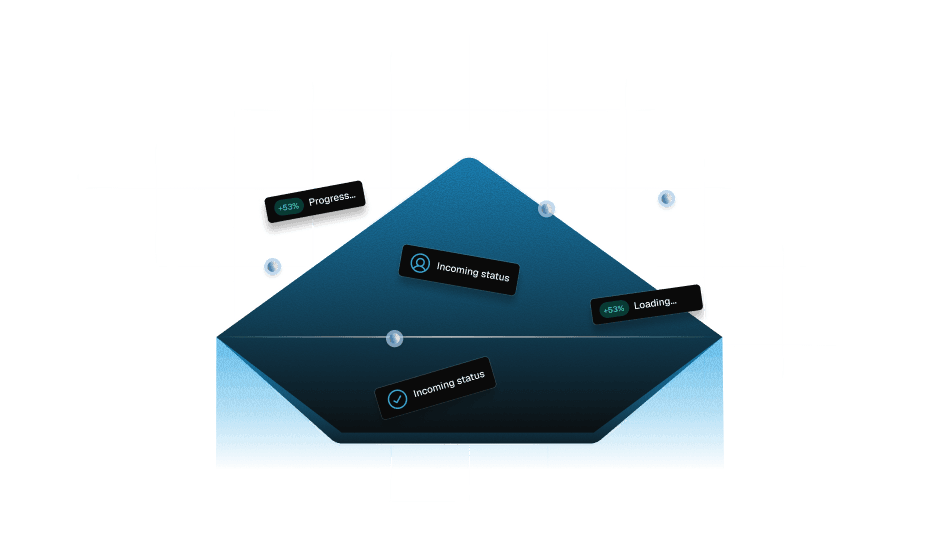
Step 4
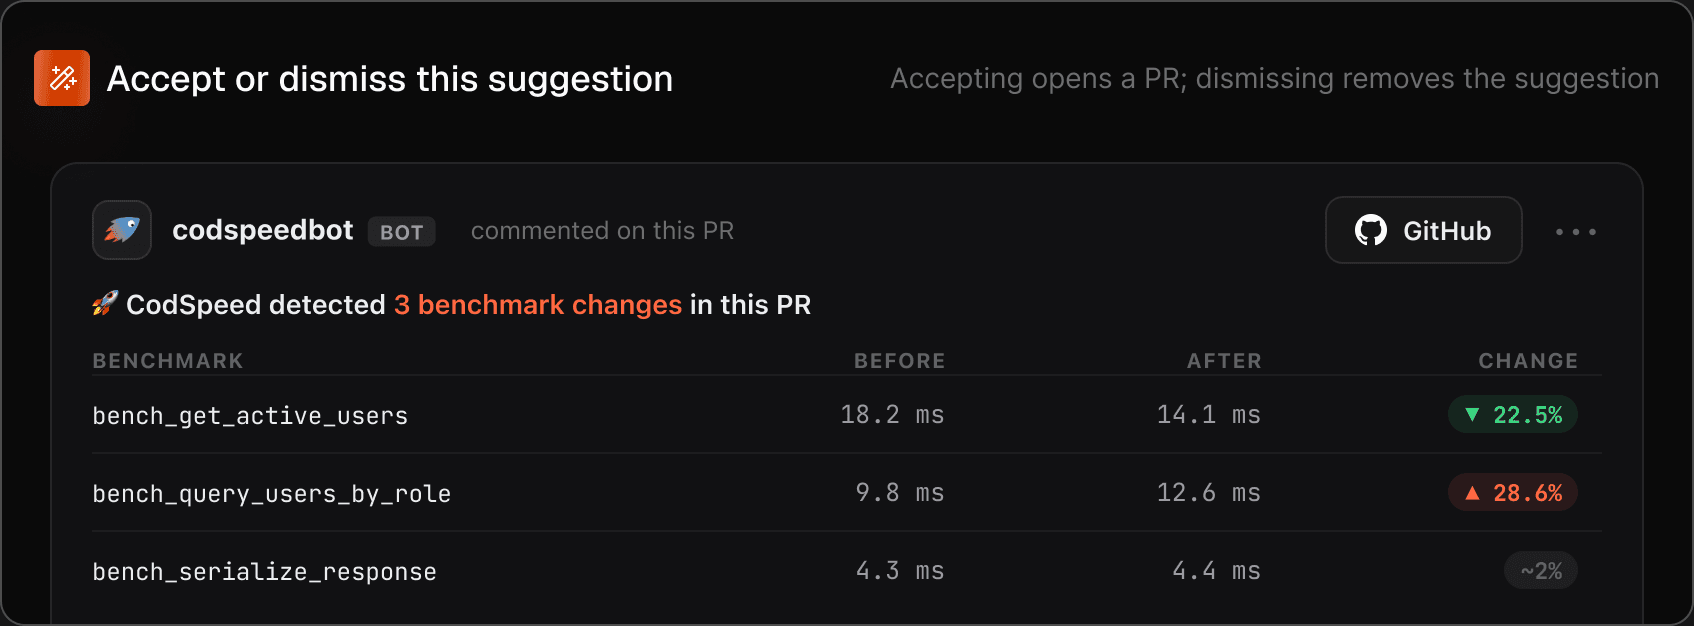
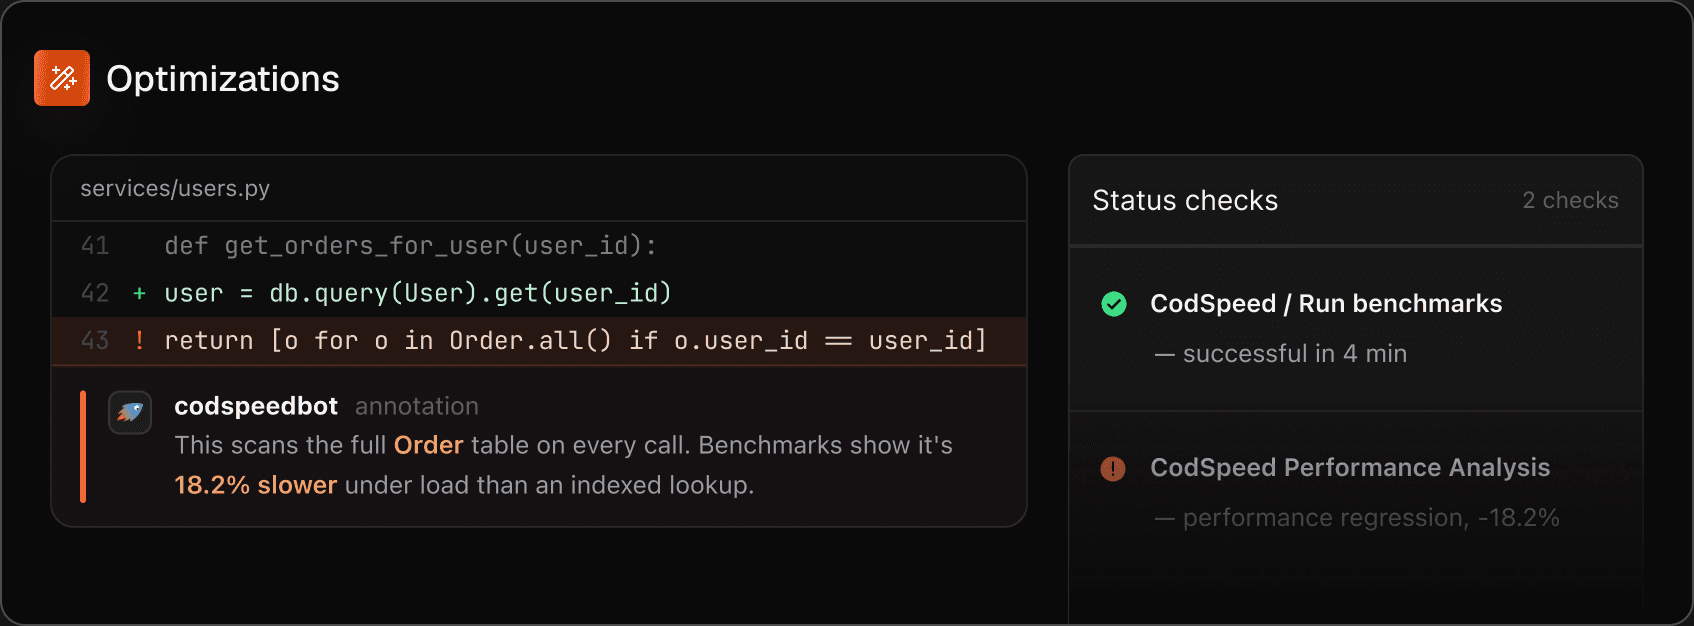
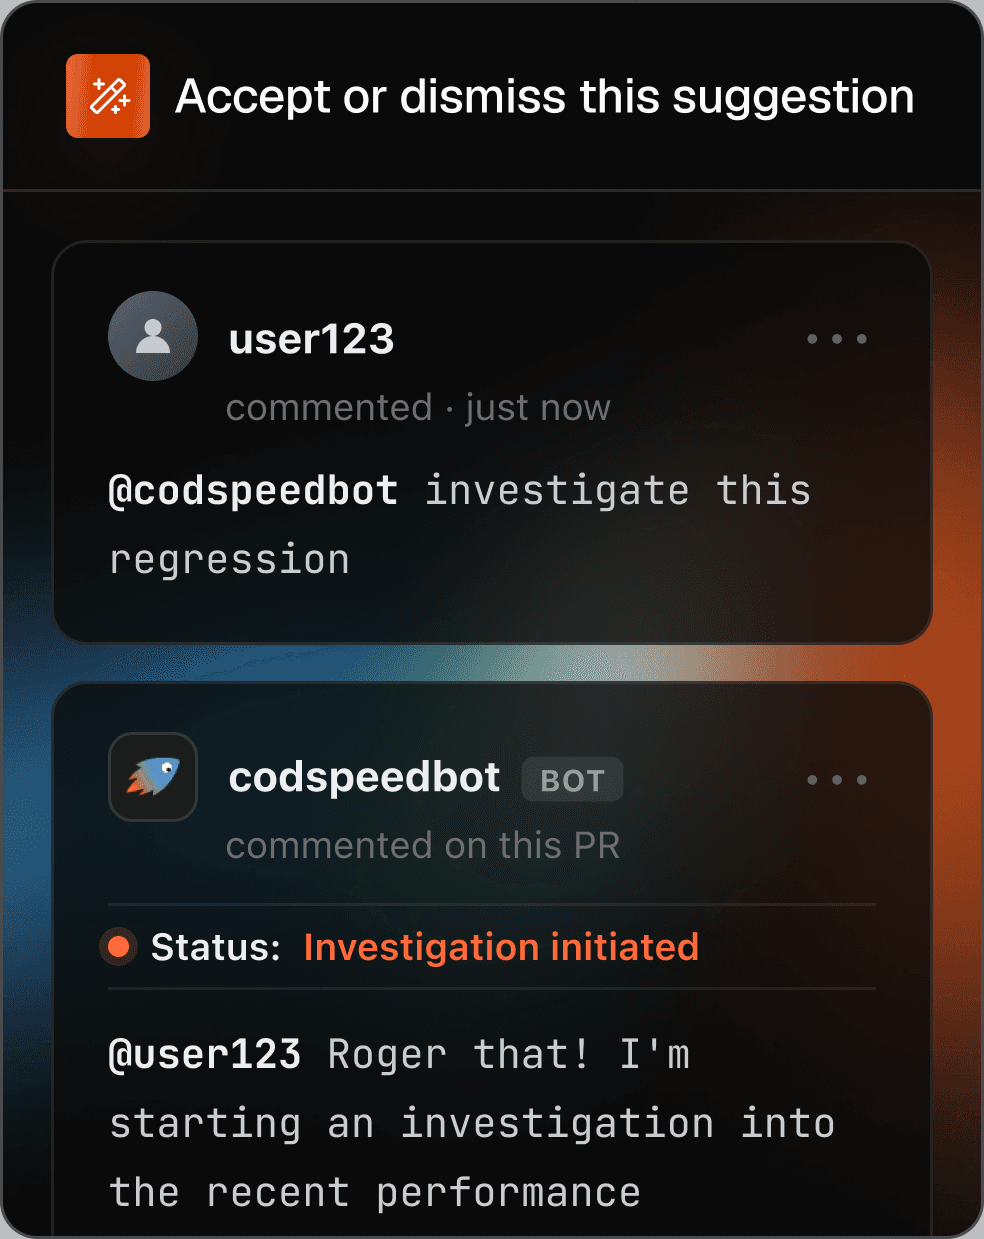
Get feedback in pull requests
Performance regressions and insights land directly in pull requests as comments and checks.
Already have benchmarks?
Just point CodSpeed to your existing benchmark suite, whether you’re using pytest-benchmark, Criterion, Vitest Bench, or something else. We’ll instrument it in place, so there’s nothing to rewrite.
Catch regressions early
Before they reach production
0 manual benchmarking
Fully automated profiling
Reliable metrics
Low-noise, reproducible results
Actionable insights
Pinpoint exactly what got slower

Built for accurateperformance testing in CI
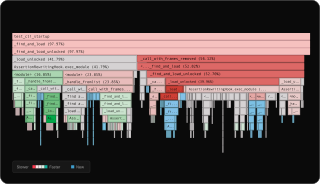
Flamegraphs show the full call stack. Width represents time. Colors highlight what changed.
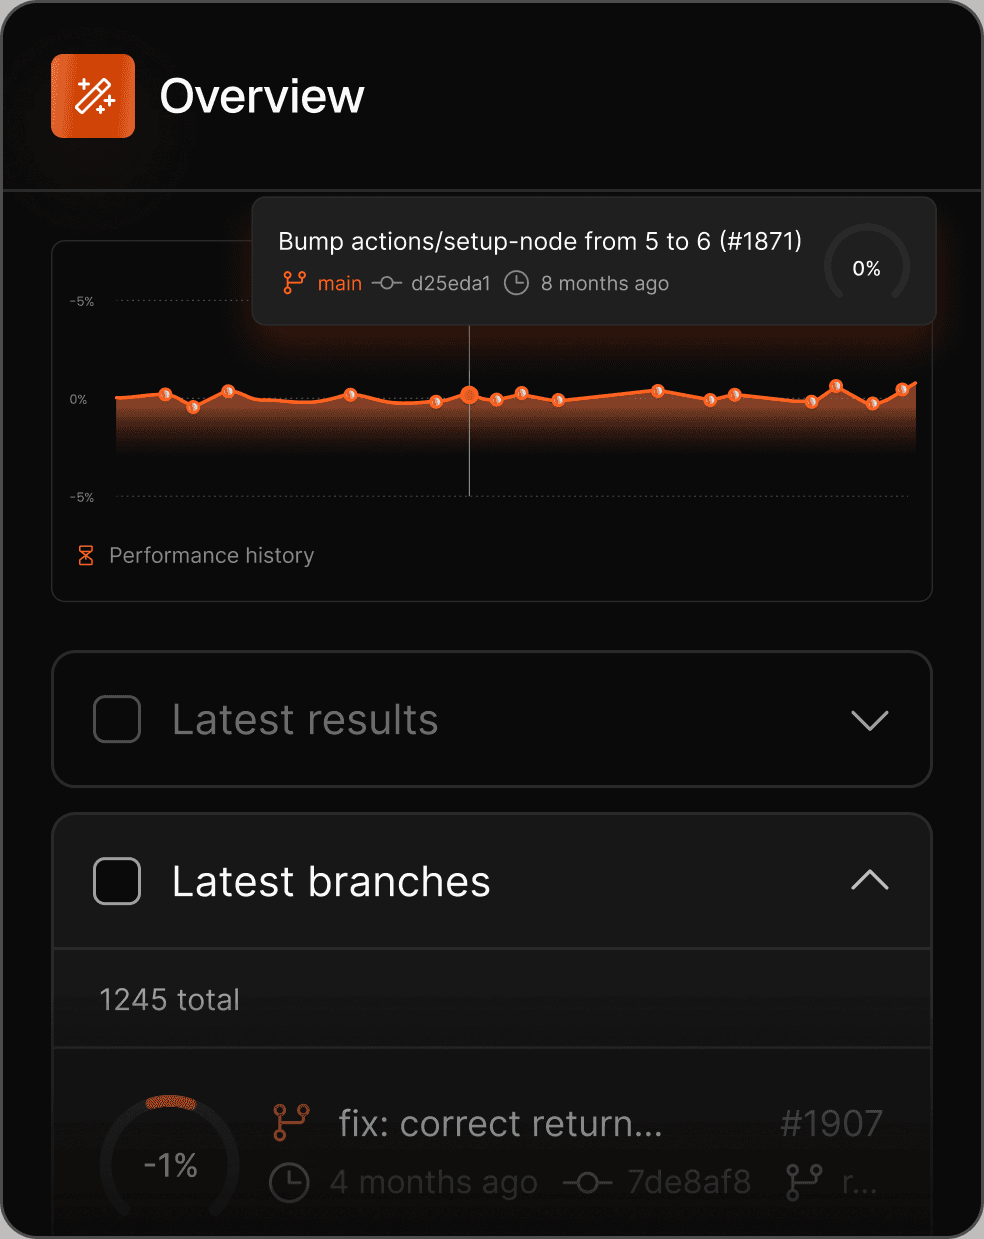
See exactly what's slowing you down
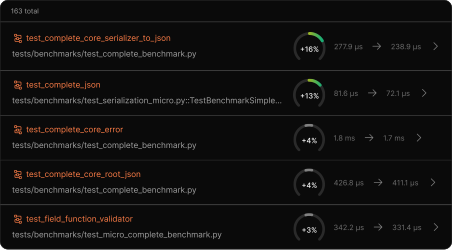
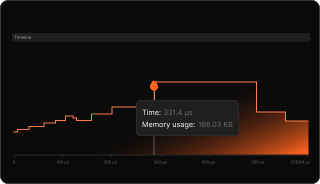
Turn raw benchmark data into actionable performance insights.
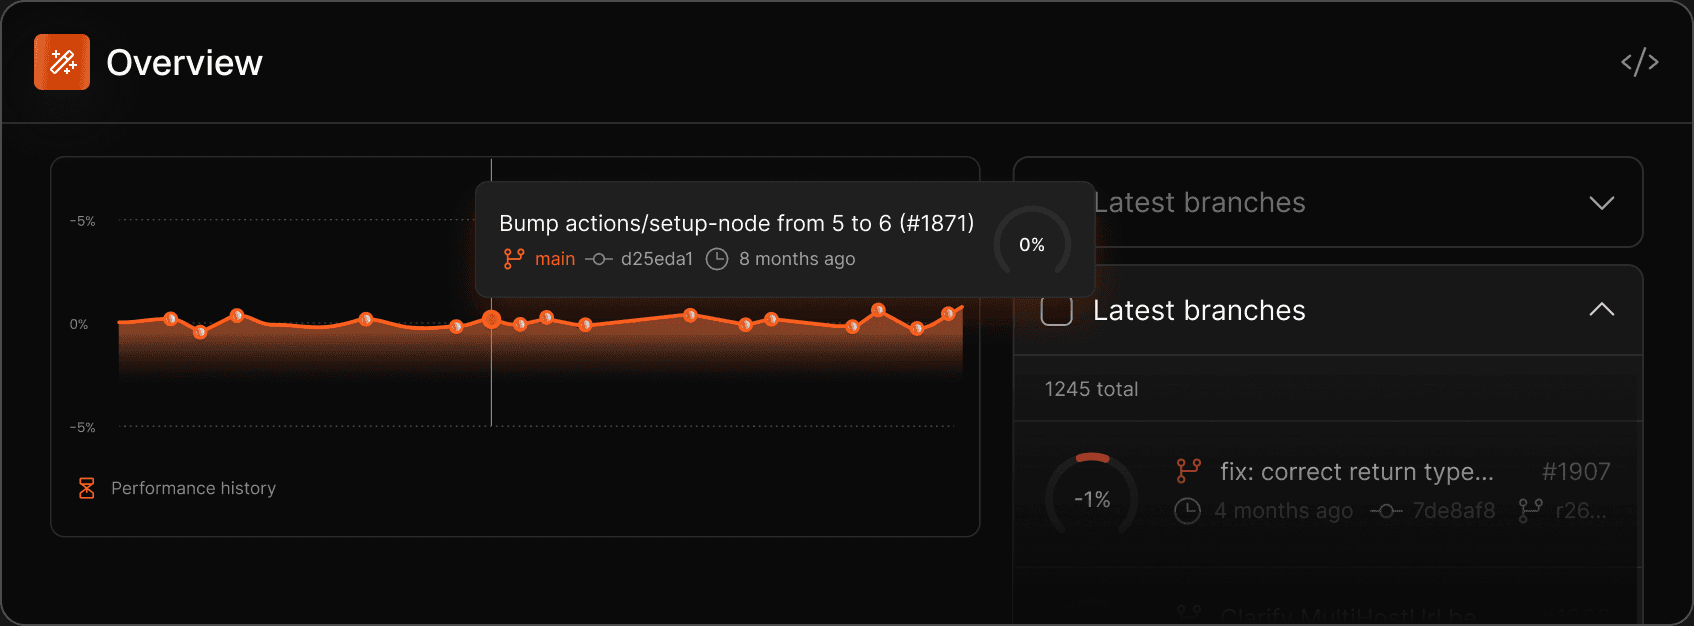
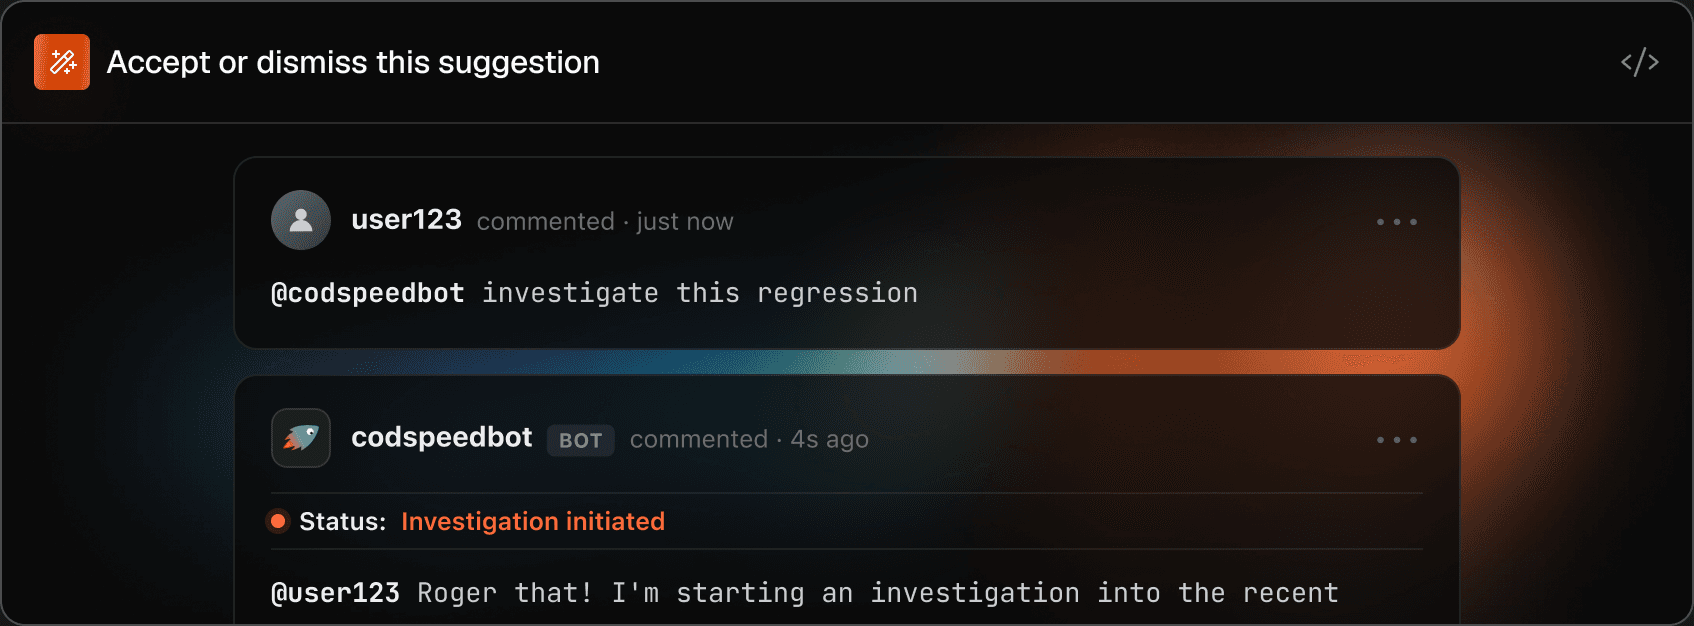
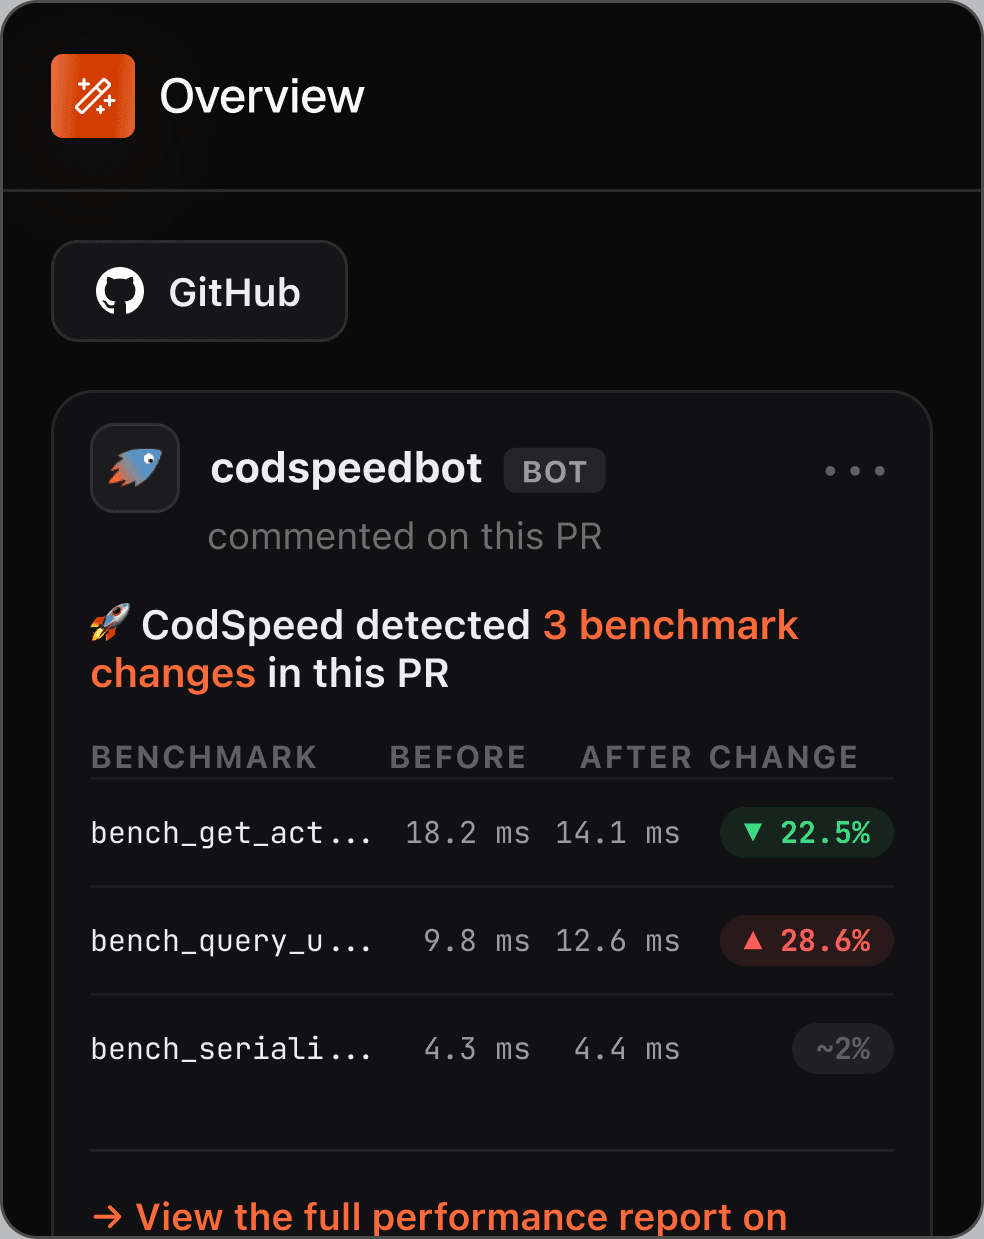
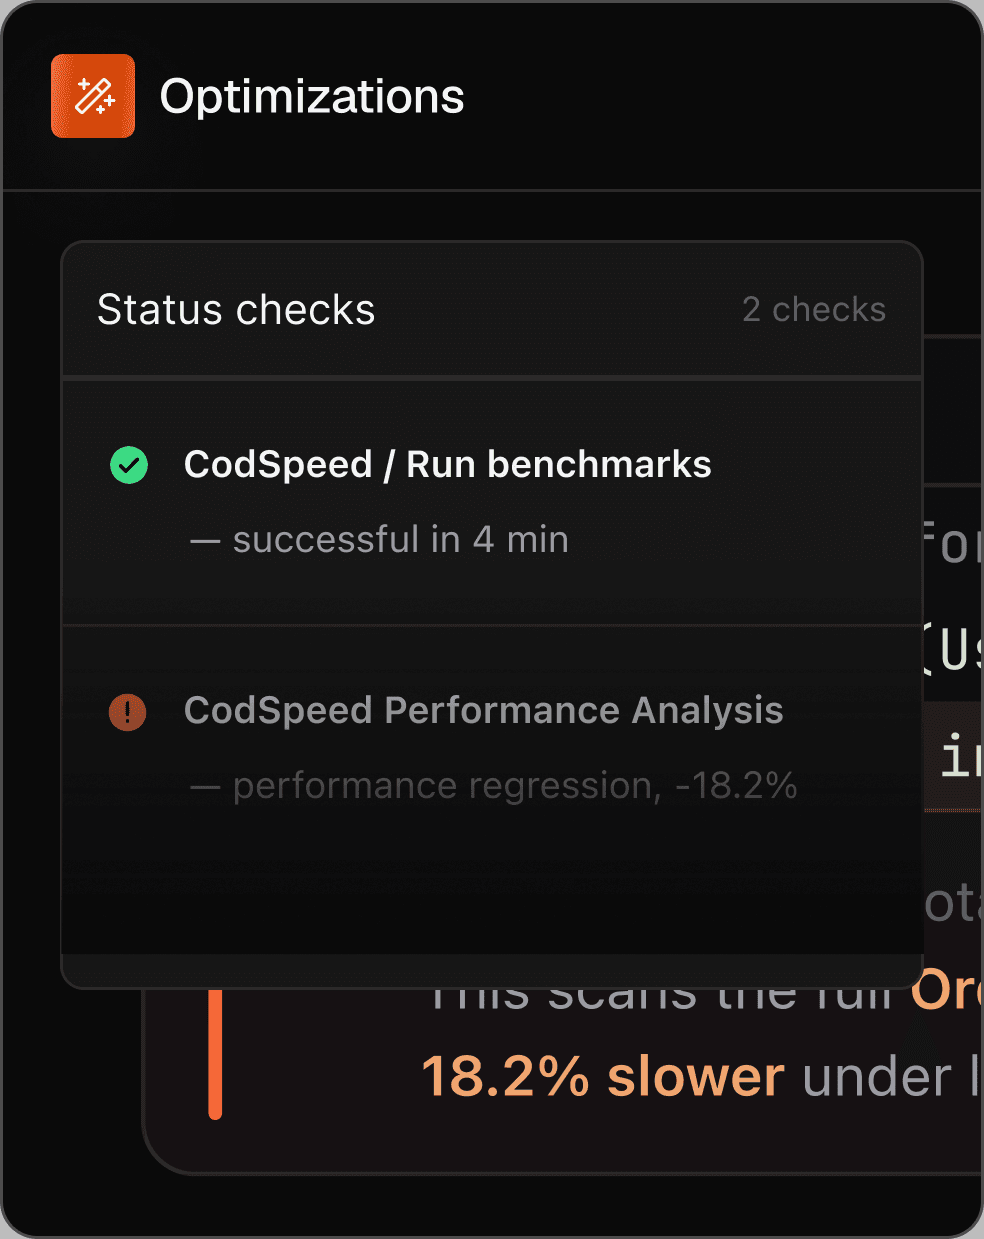
See exactly what's slowing you down
Turn raw benchmark data into actionable performance insights.

Get started in minutes
Define benchmarks that monitor performance across your entire codebase.
Define benchmarks that monitor performance across your entire codebase.
use fibonacci::fibonacci;

#[divan::bench]
fn bench_fibo_20(){
  fibonacci(20);
}

fn main() {
  divan::main();
}#include "fibonacci.h"
static void BM_Fibo_20(benchmark::State &state) {
for (auto _ : state) {
fibonacci(20);
}
}
BENCHMARK(BM_Fibo_20);
BENCHMARK_MAIN();import "testing"
import "fibonacci"
func BenchmarkFibonacci20(b *testing.B) {
for b.Loop() {
fib(20)
}
}import pytest
from my_fibo import fibonacci
@pytest.mark.benchmark
def test_fibo():
return fibonacci(20)import { bench, describe } from "vitest";
import { fibonacci } from "./myFibo";
describe("fibo", () => {
bench("fibo 20", () => {
fibonacci(20);
});
});import org.openjdk.jmh.annotations.Benchmark;
import static my.fibo.Fibonacci.fibonacci;
public class FibBenchmark {
@Benchmark
public long benchFibo20() {
return fibonacci(20);
}
}


We handle performance, so you can focus on shipping.
Talk to our team about deployment, security, and scale; or start building today.


We handle performance, so you can focus on shipping.
Talk to our team about deployment, security, and scale; or start building today.