

Oct 29, 2025
Better granularity with Inlining Information

Ever compared two benchmark runs and wondered why performance changed when you didn't touch the code? Often, the culprit is function inlining: a compiler optimization that can make frames appear to vanish from your flamegraphs.
Now, CodSpeed automatically detects and displays inlined frames in your flamegraphs, giving you complete visibility into how compiler optimizations affect your performance profile.
What you get
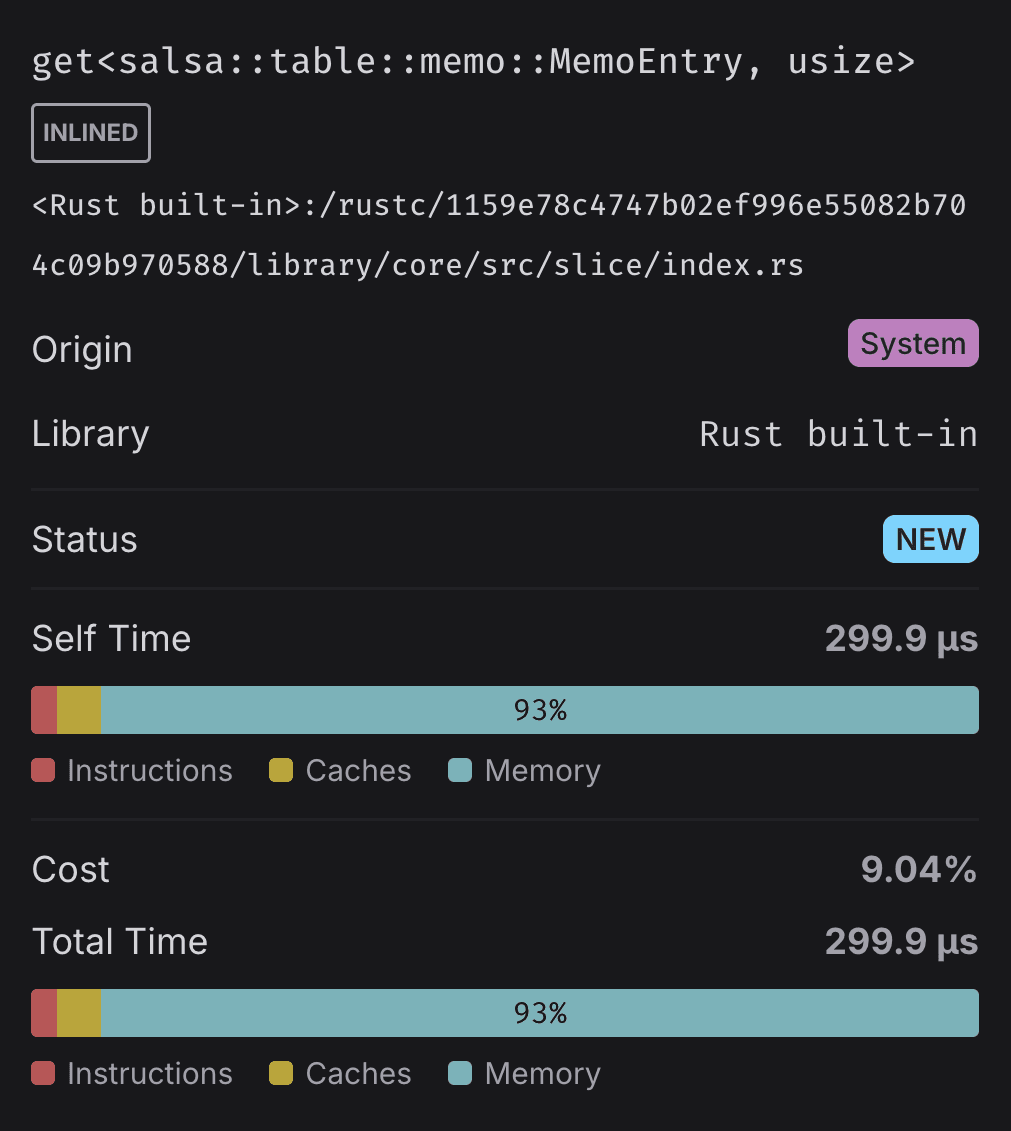
When viewing differential flamegraphs, inlined frames are explicitly marked, so you can instantly tell whether performance differences are due to:
- Compiler optimization changes between builds
- Different optimization flags (
-O2vs-O3) - Actual code changes in your application
This makes it easier to understand mysterious performance shifts, especially when comparing:
- Builds with different optimization levels
- Before and after dependency updates
- Code changes that may affect inlining decisions
How it works
The inlining information is automatically detected and displayed when using the CPU simulation instrument, no configuration needed. Inlined frames appear as marked nodes in your flamegraphs, making the call graph even more complete and accurate.
See it in action
Check out this real-world example from the
salsa project showing inlined frames in
differential flamegraphs:
Check out the complete run
When you hover over a frame in the flamegraph, you'll see whether the frame was inlined, giving you complete visibility into both your code and compiler optimizations.
Get started
This feature is available with
CodSpeedHQ/action v4.3.1
and later. If you're using the @v4 shorthand, you're already good to go!
Otherwise, update your workflow to use @v4.3.1 or later.