
Changelog

New updates and improvements released to Codspeed.

Changelog

Jul 23, 2025

Improved Profiling
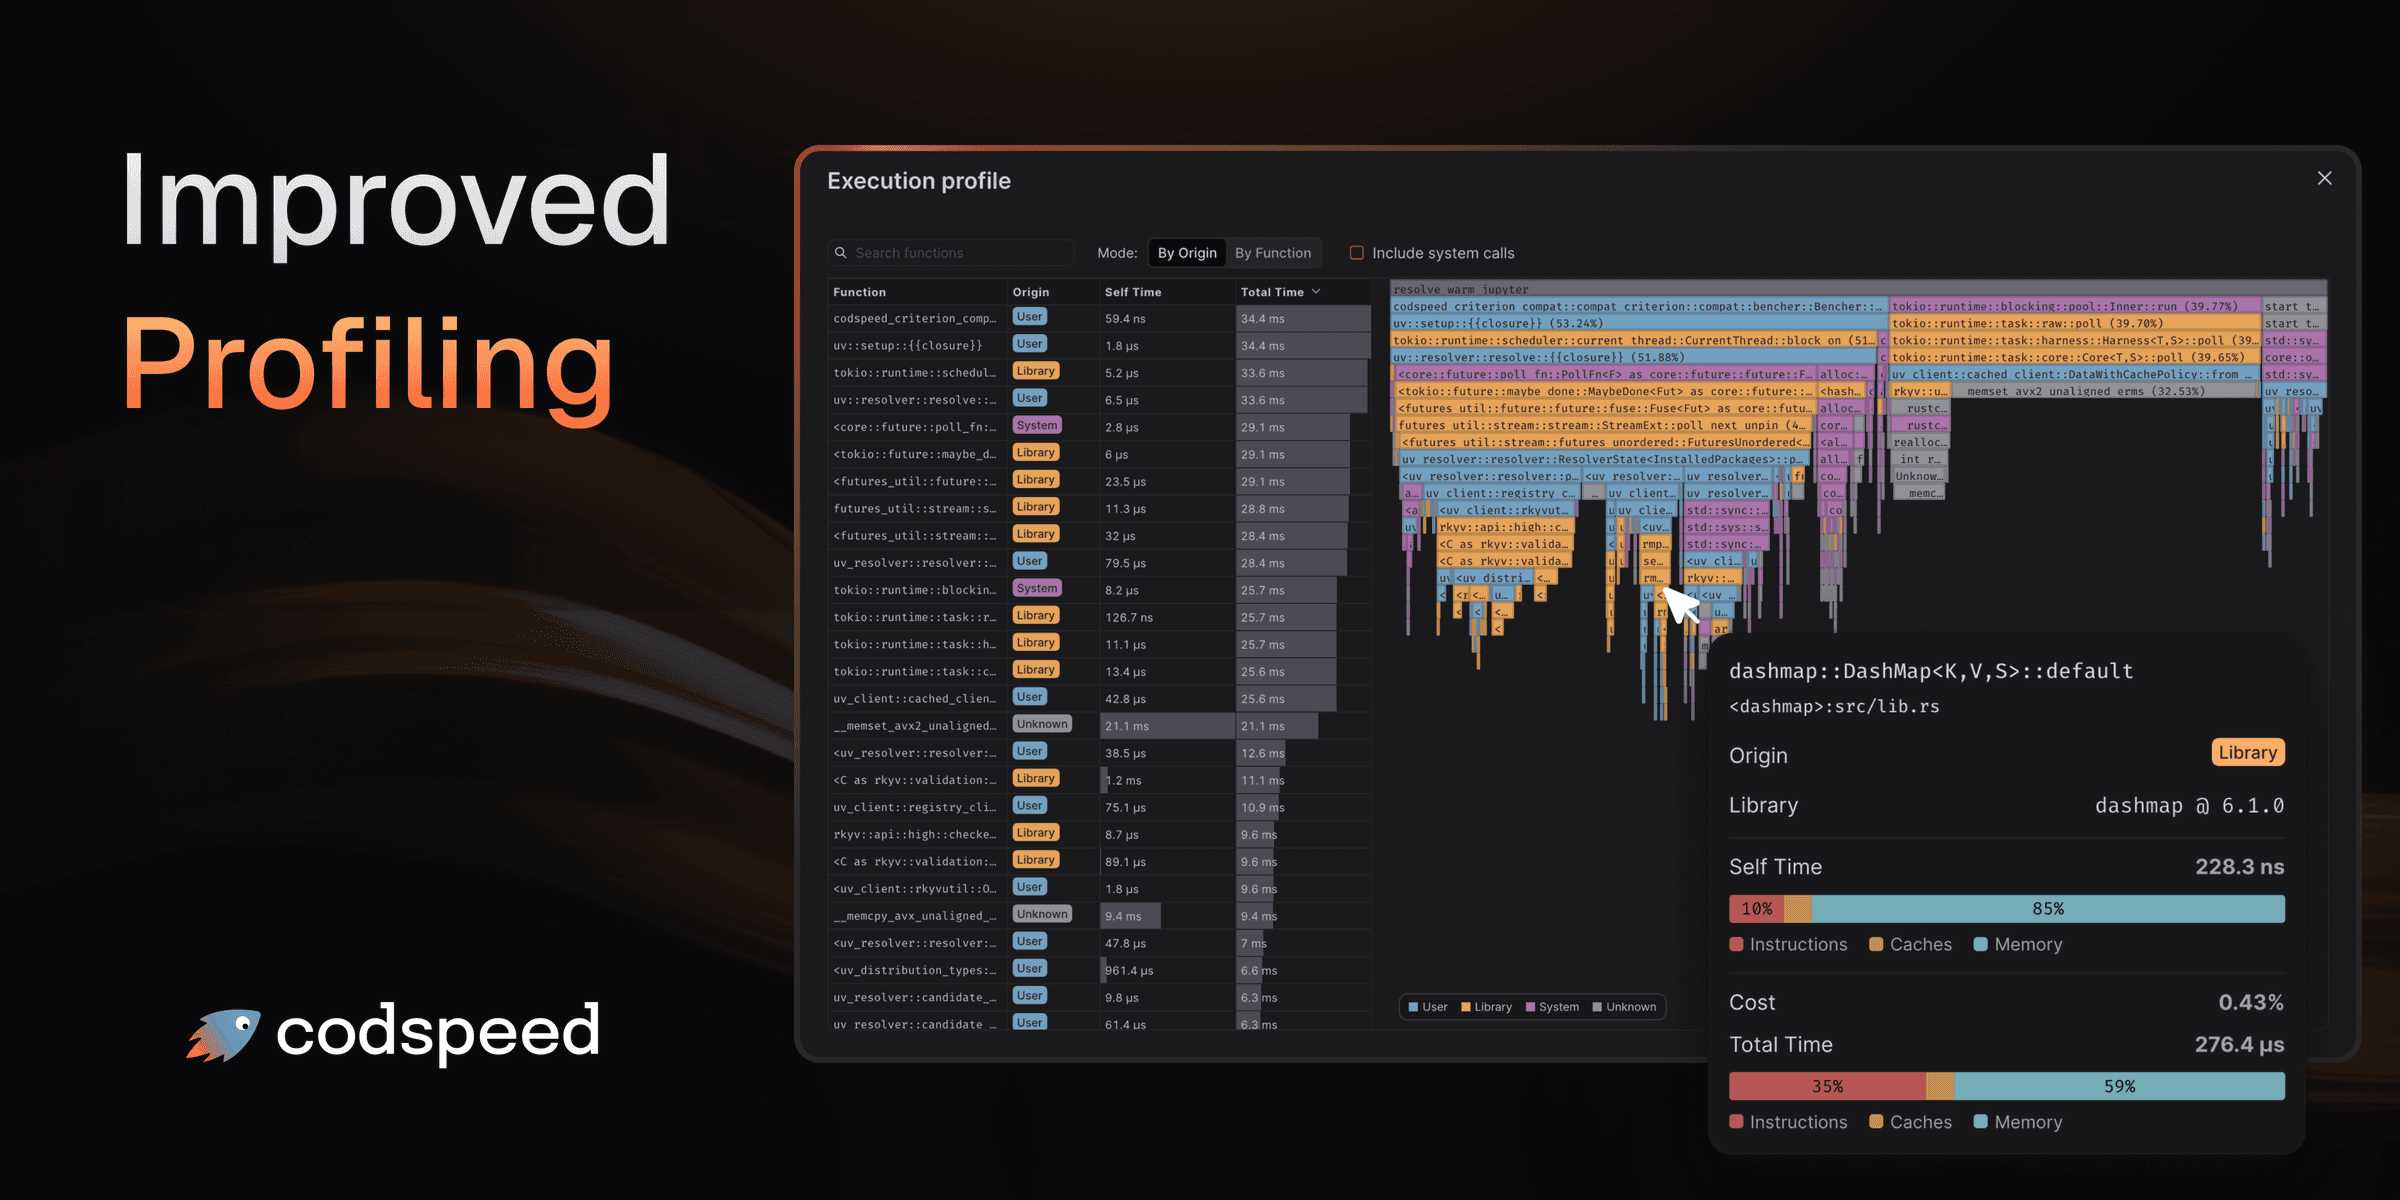
Improved Profiling

We've made a bunch of updates to make it much easier to understand where your performance issues come from and how to act on them. From identifying whether a span comes from your code or a dependency, to improving function visibility across runs, here's what's new!

Function list and origin identification

We can now identify the origin of the code that generated the span, either if it's code written by you, a library, or the system/interpreter you're using. This is useful to quickly identify the source of the span without having to think wether or not you can optimize it directly.
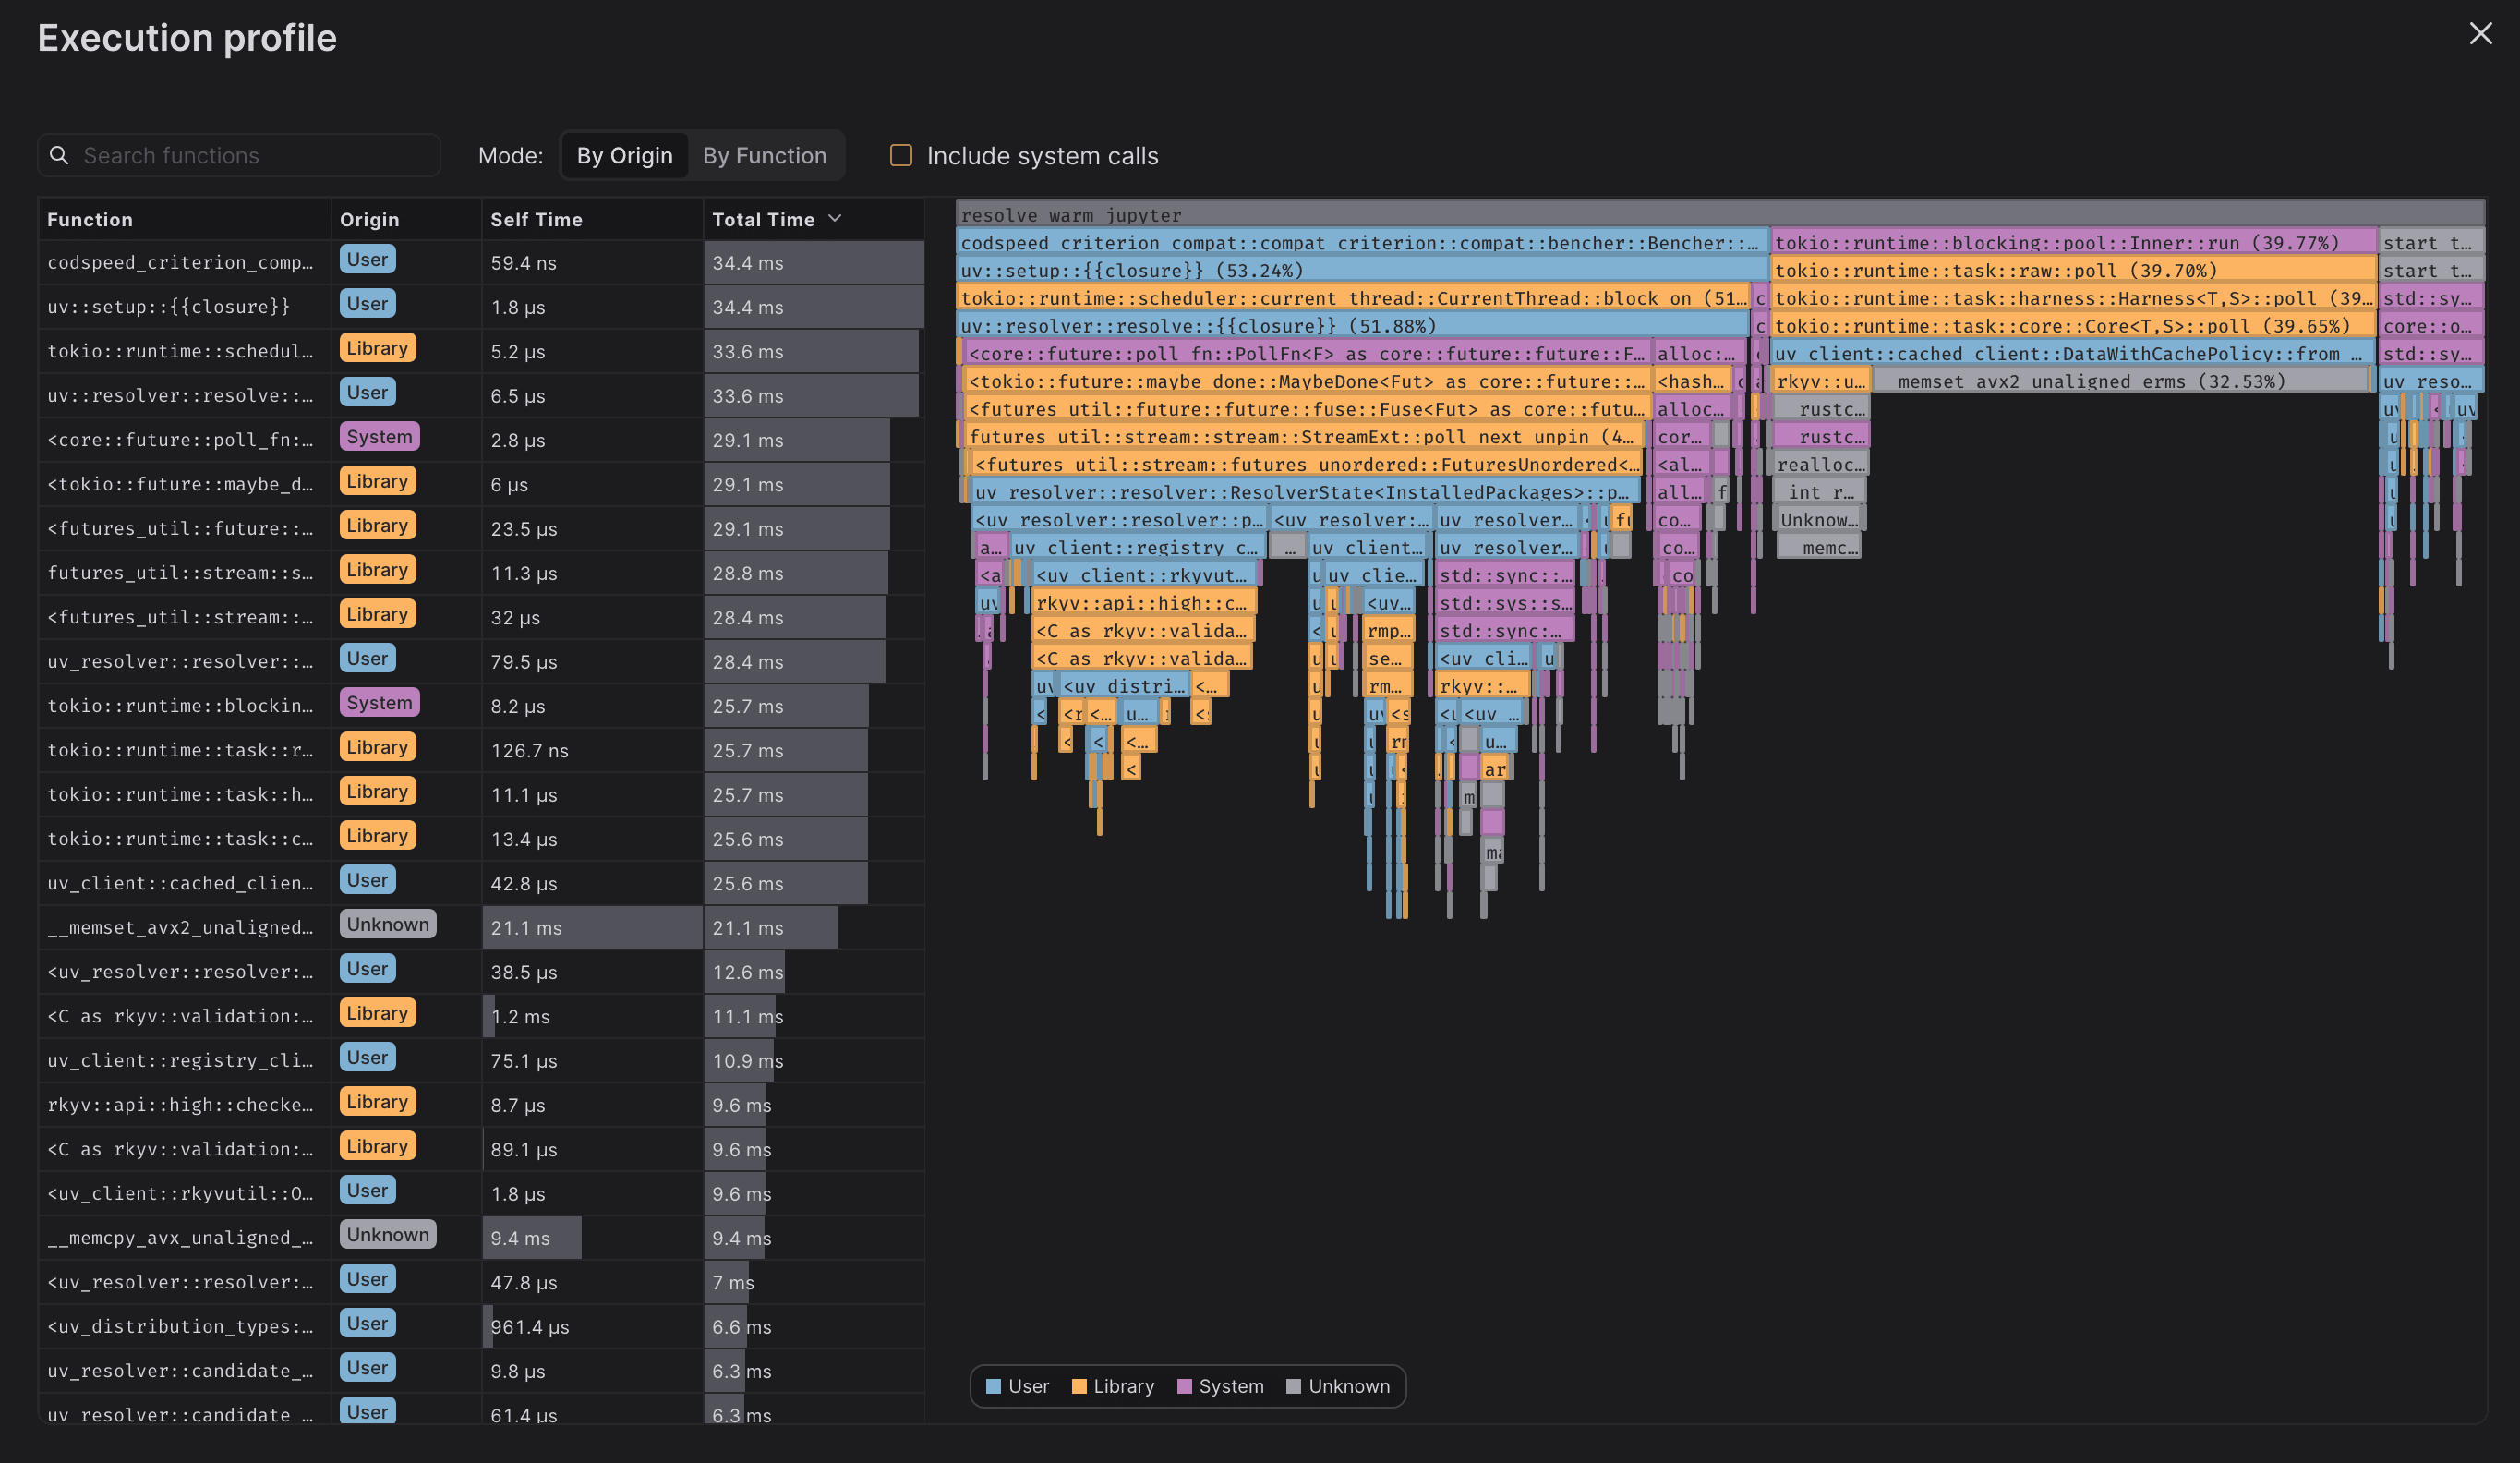
Function list

Granularity in span details

The span tooltip now displays the origin of the code that generated the span, and allocation breakdown of both the total and the self time. Making it easier to identify the bottlenecks within functions.
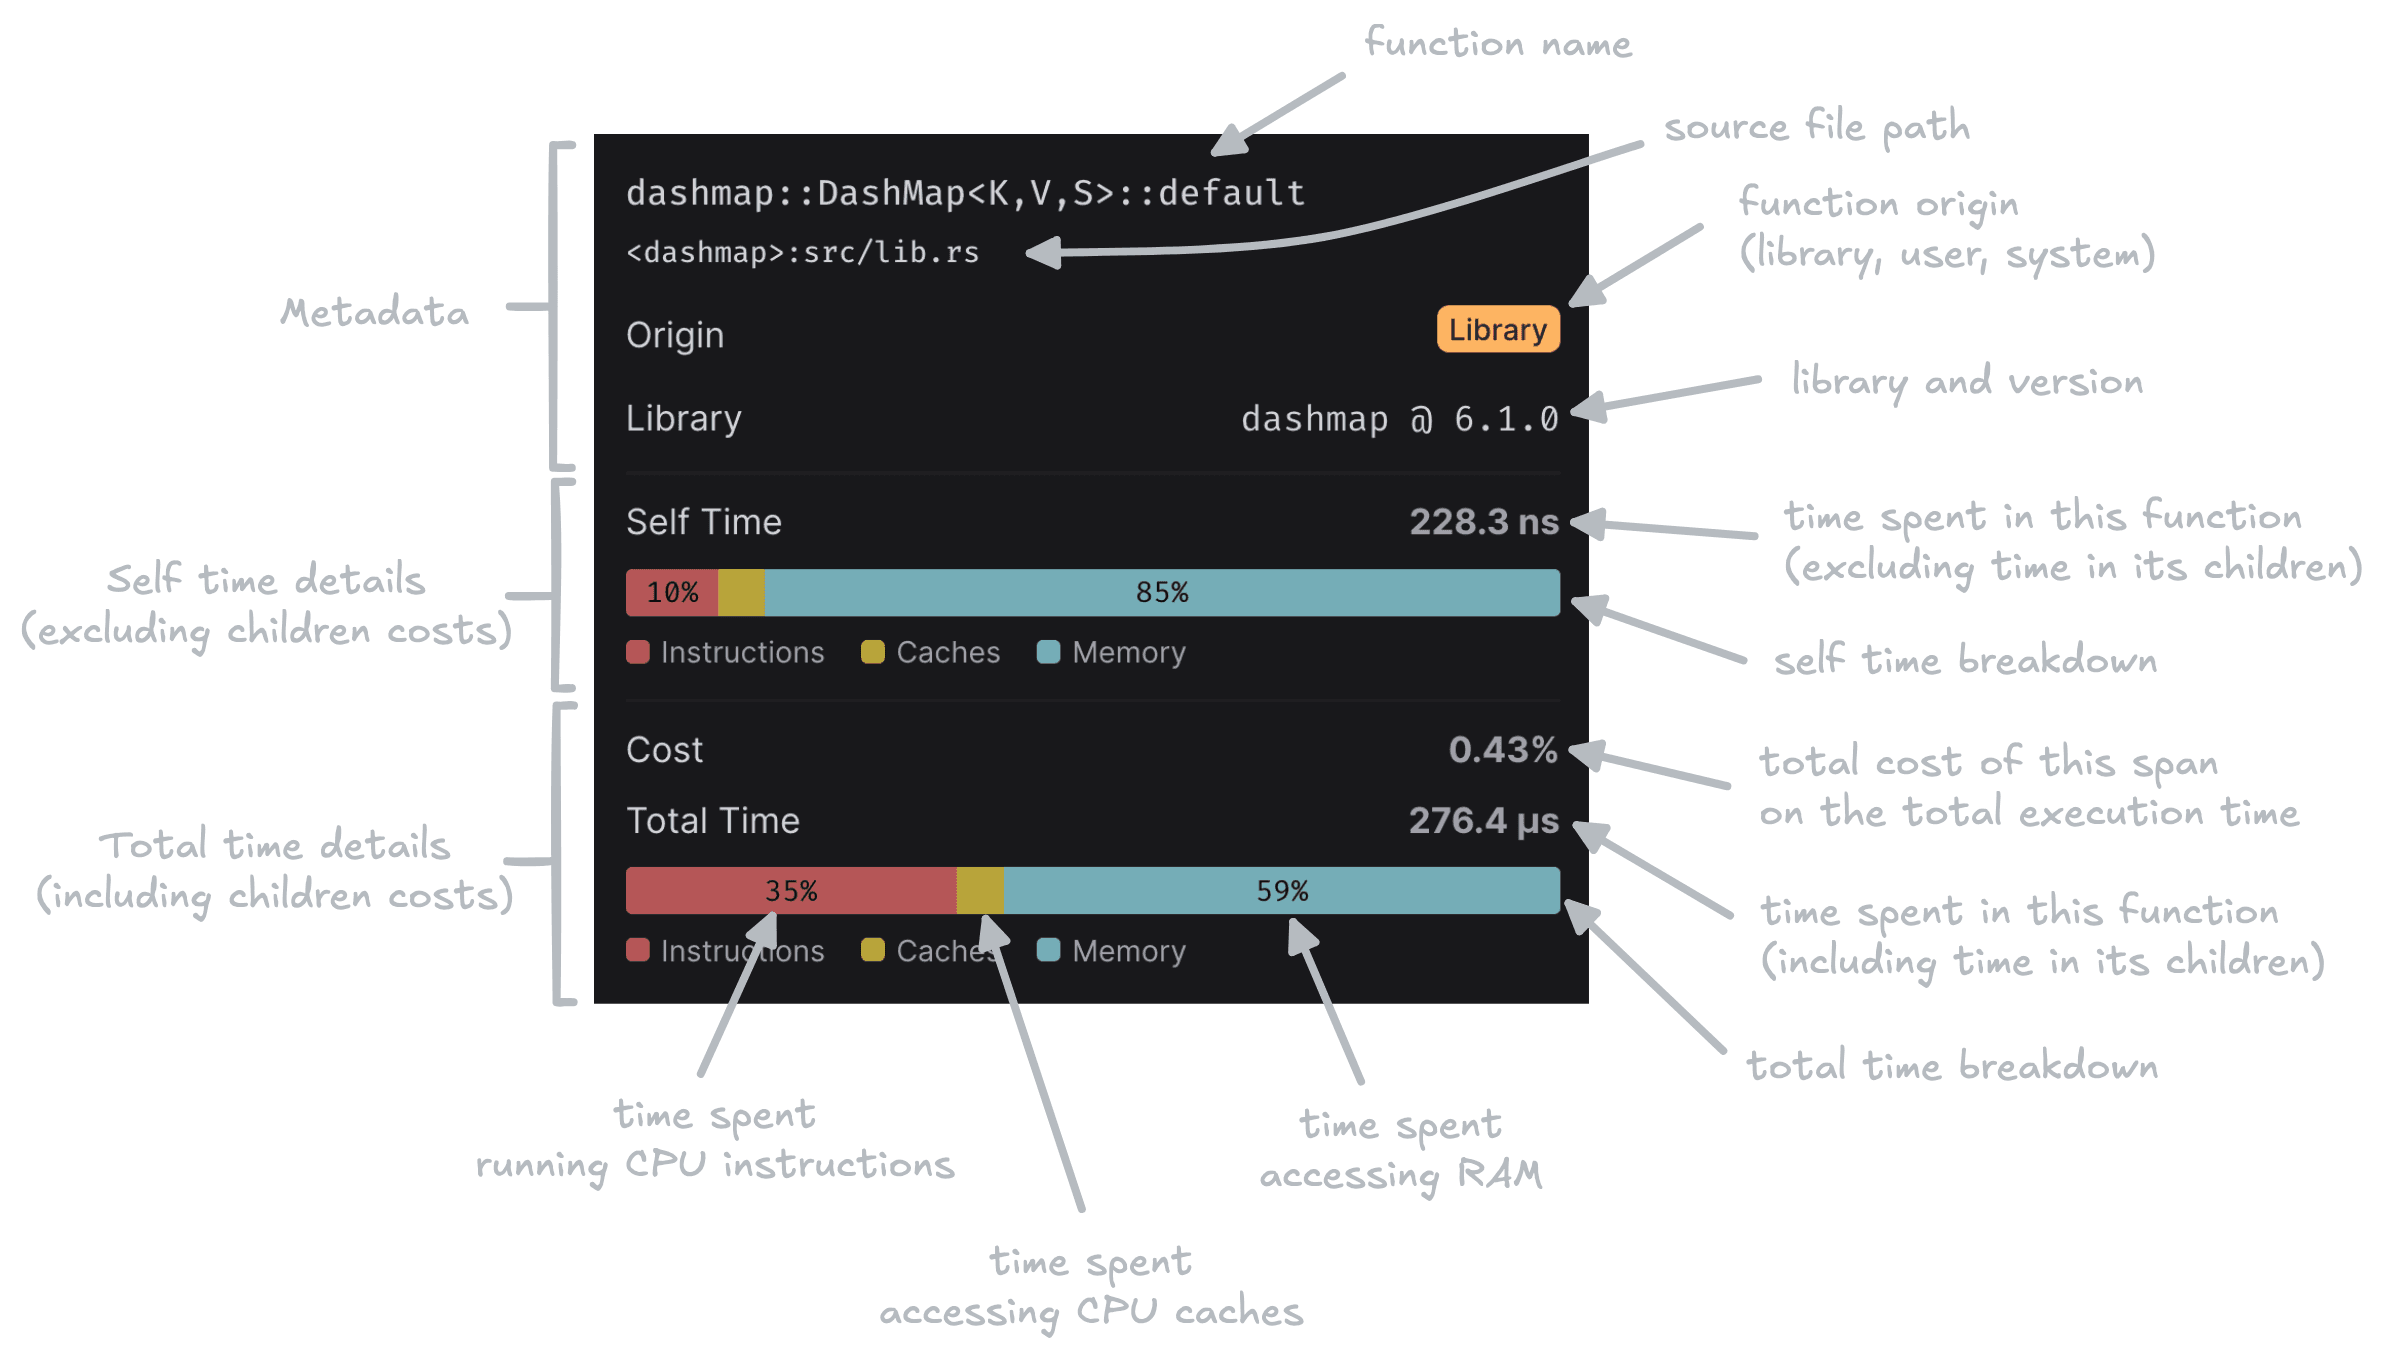
Span details

Coloring modes

By Origin

We added a new By Origin coloring mode, which colors the flamegraph by the origin of the span. Properly separating User, Library, and System spans, making it easier to identify the source of the span.
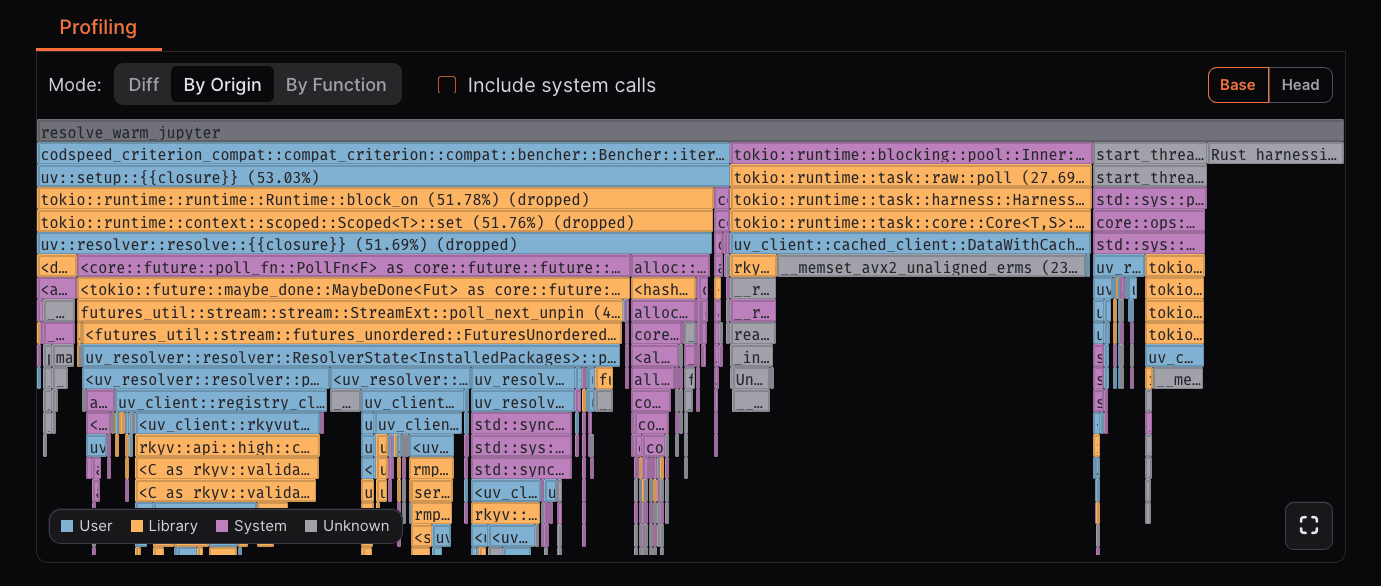
Profiling by origin

Flamegraph colored by origin from astral-sh/uv

By Function

We improved the By Function coloring mode, now the color of the function is consistent across runs and CodSpeed projects, making it easier to identify the same function across different runs.
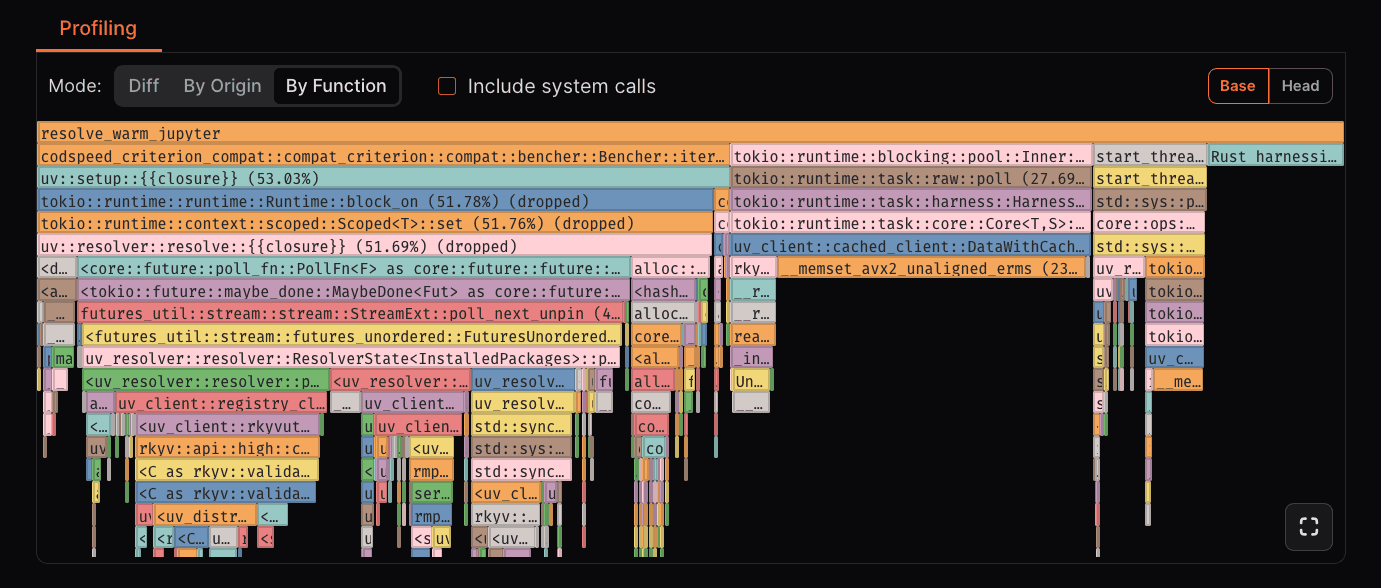
Profiling by function

Diff

Differential profiling is still available, now as a coloring mode, and now supports displaying dropped frames.
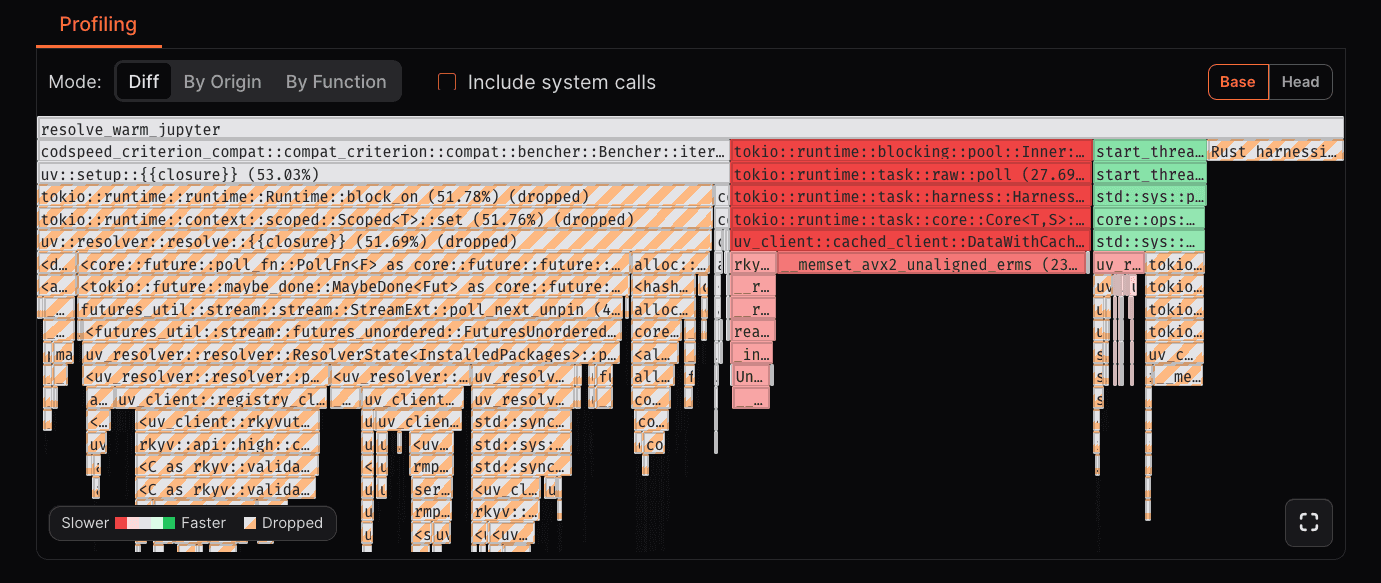
Profiling by diff

Misc

We also improved the root frame identification and now display all the root frames in the flamegraph allowing you to see more details and potentially multiple threads started before the measurement.
Read more

Jun 05, 2025

Introducing p99.chat: the assistant for software performance optimization

Introducing p99.chat: the assistant for software performance optimization

We're excited to introduce p99.chat, an AI-powered performance analysis assistant, simplifying how to approach software optimization!

Performance troubleshooting traditionally requires juggling multiple tools, including sampling profilers, instrumentation, benchmarks, and visualizations, as well as manually connecting them to your codebase. Each tool has its own setup requirements, data formats, and workflow, which can turn what should be rapid iteration into hours of configuration. You spend more time wrestling with toolchains than actually optimizing code.

p99 eliminates this friction by providing an integrated chat interface that handles code analysis, instrumentation, and visualization in one seamless experience. Instead of context-switching between tools, you describe your performance challenge, and p99 orchestrates the entire analysis pipeline.

Share your code and performance goals. p99 will analyze, instrument, and visualize the results, cutting the traditional setup overhead down to seconds.

Check it out this chat here!

What can it do?

  • Write and optimize algorithms in Python and Rust
  • Execute and profile code using CodSpeed's CPU Instrumentation
  • Generate performance visualizations, including flamegraphs and charts
  • Compare algorithm performance

What's coming next?

  • MCP integration: Seamlessly connect p99 with your code editor for real-time performance optimization
  • More instruments: Memory profiling, walltime analysis, static analysis, and GPU profiling
  • GitHub integration: Reference code directly from repositories within the chat
  • Automated pull requests: Persist improvements and benchmarks with continuous performance monitoring
  • Expanded language support: More runtime environments and analysis capabilities

How to get started?

p99 is now globally available and completely free to use. Try it now at p99.chat!

Read more

May 06, 2025

C++

First Class Bazel Support for C++

First Class Bazel Support for C++

You can now use CodSpeed with Bazel build systems thanks to our enhanced C++ integration!

This addition complements our existing CMake support, making it easier to benchmark large-scale C++ projects with complex build configurations. Bazel support is particularly valuable for enterprise teams working with monorepos and sophisticated dependency management.

Quick Start

Add CodSpeed to your Bazel workspace by adding this to your WORKSPACE file:

load("@bazel_tools//tools/build_defs/repo:http.bzl", "http_archive")

http_archive(
    name = "codspeed_cpp",
    urls = ["https://github.com/CodSpeedHQ/codspeed-cpp/archive/refs/heads/main.zip"],
    strip_prefix = "codspeed-cpp-main",
)

Then define your benchmark target in your package's BUILD.bazel file:

cc_binary(
    name = "my_benchmark",
    srcs = glob(["*.cpp", "*.hpp"]),
    deps = [
        "@codspeed_cpp//google_benchmark:benchmark",
    ],
)

Running Benchmarks

Build and run your benchmarks with the CodSpeed instrumentation flag:

# Build your benchmark
bazel build //path/to/bench:my_benchmark --@codspeed_cpp//core:codspeed_mode=instrumentation

# Run it locally
bazel run //path/to/bench:my_benchmark --@codspeed_cpp//core:codspeed_mode=instrumentation

For more information, check out the Bazel section of C++ documentation.

Read more

Mar 27, 2025

C++

C++ Support

C++ Support

You can now use CodSpeed to benchmark C++ codebases thanks to our new integration with google/benchmark`.

Quick Start

CodSpeed's C++ support works out of the box with CMake:

# Fetch the CodSpeed compatibility layer
FetchContent_Declare(
    google_benchmark
    GIT_REPOSITORY https://github.com/CodSpeedHQ/codspeed-cpp
    SOURCE_SUBDIR google_benchmark
    GIT_TAG main # Or chose a specific version or git ref
)
FetchContent_MakeAvailable(google_benchmark)

# Declare your benchmark executable and its sources here
add_executable(bench_fibo benches/fibo.cpp)

# Link your executable against the `benchmark::benchmark`
target_link_libraries(bench_fibo benchmark::benchmark)

You can then write your benchmarks in C++ using the google/benchmark API. Here's an example:

#include <benchmark/benchmark.h>

static void BM_Fib(benchmark::State& state) {
  auto fib = [](int n) {
    return n < 2 ? n : fib(n - 1) + fib(n - 2);
  };

  for (auto _ : state)
    benchmark::DoNotOptimize(fib(10));
}

BENCHMARK(BM_Fib);
BENCHMARK_MAIN();

This can then run both locally and in CI environments using the CodSpeed Runner. Check out the documentation on integrating the runner in CI environments.

Real World Examples

Here are a few example repositories of real-world C++ projects:

  • boost-benches: a collection of benchmarks for the Boost C++ Libraries
  • opencv-benches: a collection of benchmarks for the OpenCV library

Check out our C++ documentation for more details.

Read more

Mar 04, 2025

Free Plan and Macro Runners Now Globally Available

Free Plan and Macro Runners Now Globally Available

We understand that performance matters for teams of all sizes—from indie developers and startups to large enterprises. Yet, traditional performance monitoring tools can be prohibitively expensive, creating a barrier for smaller teams and open-source projects. Today, we're breaking down those barriers with two new features that bring enterprise-grade performance insights within reach of every developer.

Free Plan for Private Repositories

Now, small teams can leverage powerful performance insights without breaking the bank. Our new Free plan allows:

  • Up to 5 users
  • Unlimited private repositories
  • 3-month performance history
  • CI integration
  • Pull-Request performance reports and checks
  • 120 free macro runner minutes per month

Macro Runners Now Globally Available

We're rolling out our high-performance benchmark runners worldwide. Every user and organization now gets:

  • 120 free macro runner minutes per month
  • Macro Runners instances with:
    • Bare-metal 16-core ARM64 CPUs
    • 32 GB RAM
    • Isolated machines to minimize environmental noise
    • Optimized for consistency and performance measurement

These macro runners can be used along with our Walltime instruments to measure the absolute performance of your code. After the initial free minutes, you can continue using macro runners with flexible, usage-based pricing that grows with your needs.

These improvements ensure that even teams with limited resources can make data-driven optimization decisions.

Get started with your free account today or learn more about our pricing.

Read more

Feb 28, 2025

Faster Workflows with Sharded Benchmarks

Faster Workflows with Sharded Benchmarks

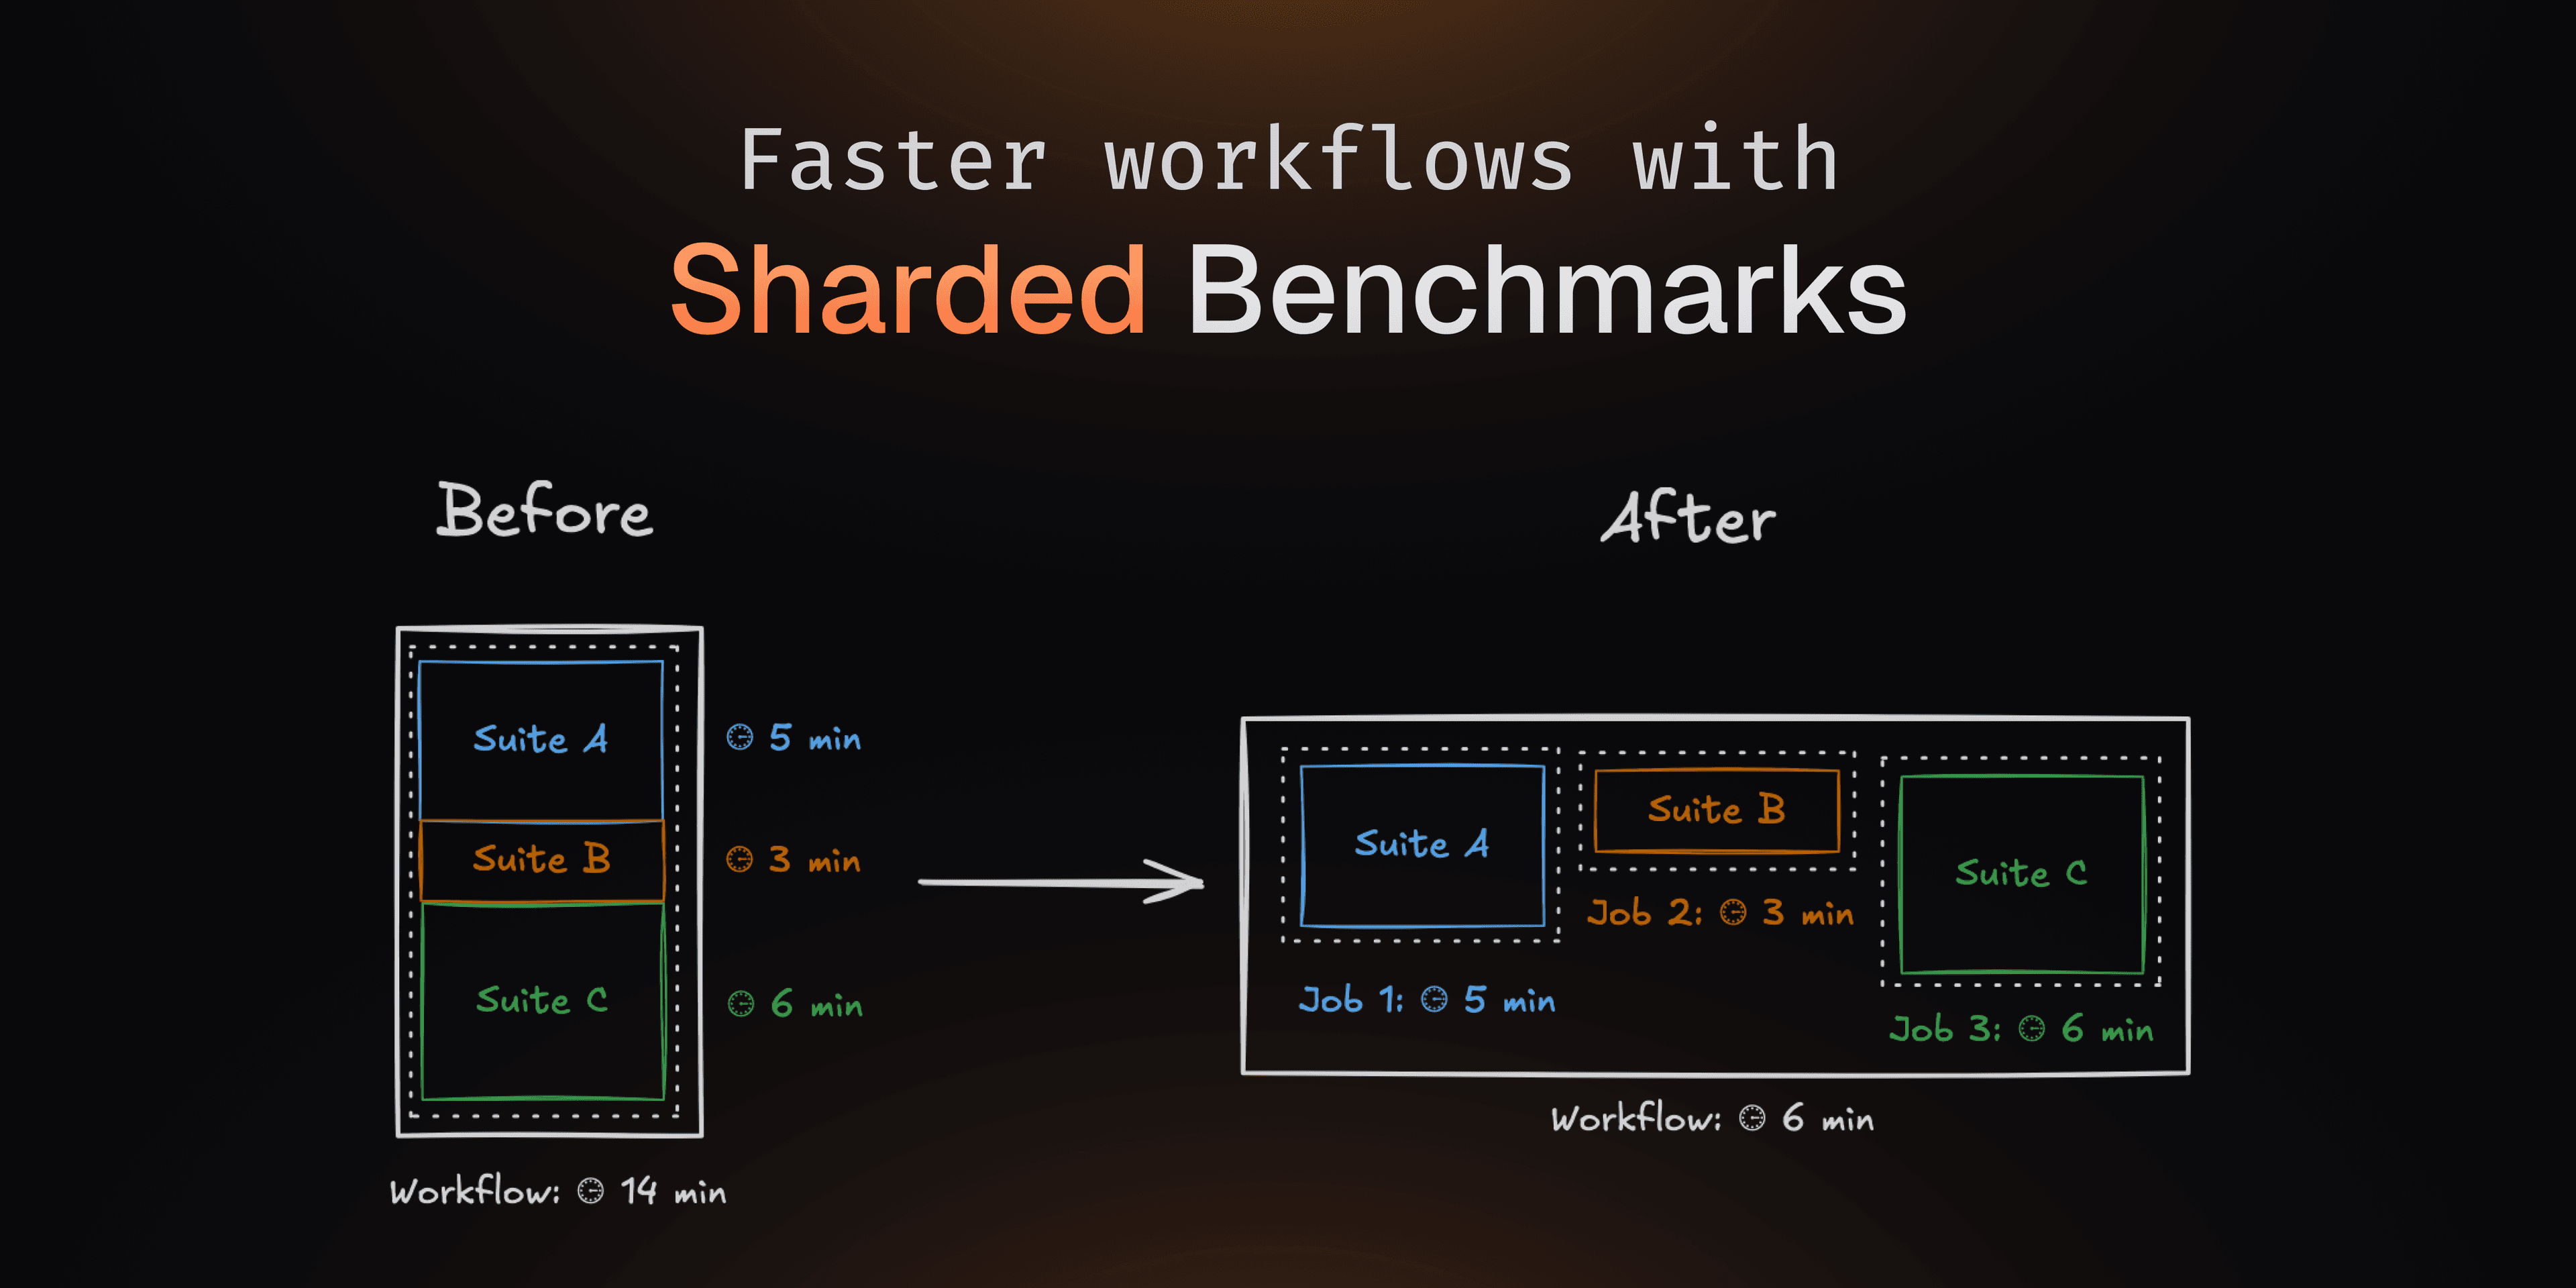
Running benchmarks can be slow and significantly impact your CI time. You can now split your benchmark suite across multiple jobs in the same CI workflow, reducing execution time by running them in parallel.

When running heavy benchmark suites, this can divide the total runtime by the number of jobs, dramatically speeding up your CI pipeline. CodSpeed then aggregates the results into a single report, ensuring accurate performance tracking.


For example, using pytest:

# .github/workflows/codspeed.yml

jobs:
  benchmarks:
    strategy:
      matrix:
        shard: [1, 2, 3, 4] 

    name: "Run benchmarks (Shard #${{ matrix.shard }})"
    runs-on: ubuntu-latest
    steps:
      - uses: actions/checkout@v4
      - uses: actions/setup-python@v2
        with:
          python-version: 3.12.8
      - run: pip install -r requirements.txt
      - name: Run benchmarks
        uses: CodSpeedHQ/action@v3
        with:
          run:
            pytest tests/ --test-group=${{ matrix.shard }} --test-group-count=4
          token: ${{ secrets.CODSPEED_TOKEN }}

Learn more about benchmark sharding and how to integrate it in your CI.

Multi-language Support

With benchmarks written in several languages, it can be difficult to get a unified performance overview of your project.

You can now run benchmarks written in multiple languages. When run in the same CI workflow, CodSpeed will aggregate the results of these benchmarks into a single report.

For example, using pytest and vitest:

# .github/workflows/codspeed.yml

jobs:
  python-benchmarks:
    name: "Run Python benchmarks"
    runs-on: ubuntu-latest
    steps:
      - uses: actions/checkout@v4
      - name: Install required-version defined in uv.toml
        uses: astral-sh/setup-uv@v5
      - uses: actions/setup-python@v2
        with:
          python-version: 3.12.8
      - name: Run benchmarks
        uses: CodSpeedHQ/action@v3
        with:
          run: uv run pytest tests/benchmarks/ --codspeed
          token: ${{ secrets.CODSPEED_TOKEN }}

  nodejs-benchmarks:
    name: "Run NodeJS benchmarks"
    runs-on: ubuntu-latest
    steps:
      - uses: actions/checkout@v4
      - uses: "actions/setup-node@v3"
      - name: Install dependencies
        run: npm install
      - name: Run benchmarks
        uses: CodSpeedHQ/action@v3
        with:
          run: npm exec vitest bench
          token: ${{ secrets.CODSPEED_TOKEN }}

Learn more about multi-language support.

Read more

Feb 13, 2025

Rust

Divan Support for Rust

Divan Support for Rust

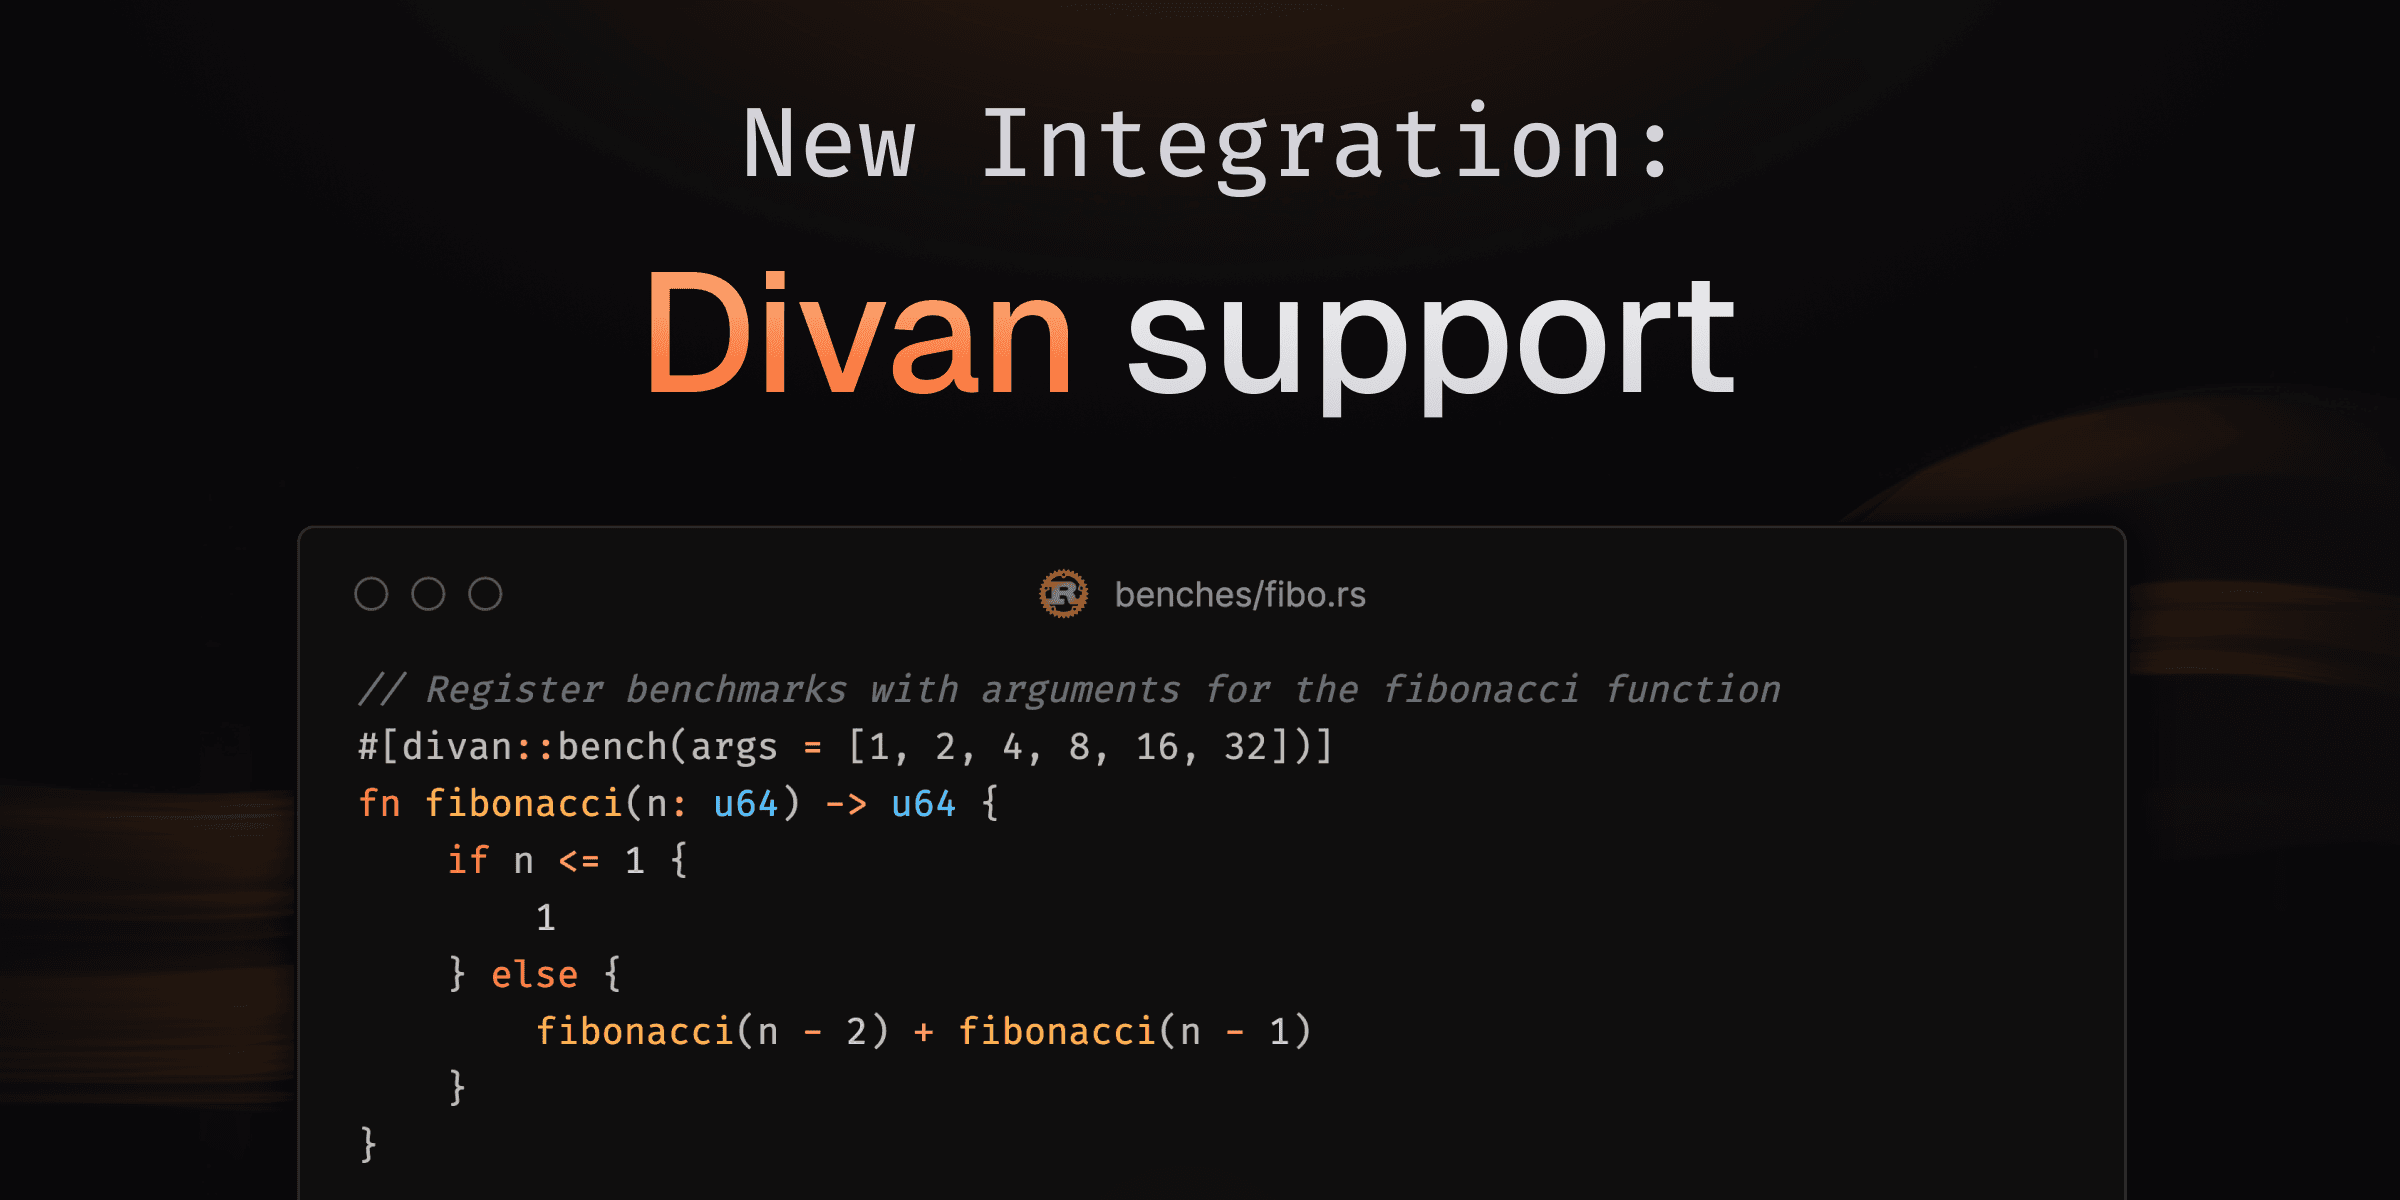
We're excited to announce a new Rust integration with Divan 🛋️, a fast and simple benchmarking framework! 🚀

Divan offers a straightforward API that simplifies the benchmarking process, allowing you to register benchmarks with ease. Unlike Criterion.rs, which can be more complex, or Bencher, which is less feature-rich, Divan provides a balanced approach with its user-friendly interface and powerful capabilities.

Here's an example of how you can use Divan to benchmark a function:

/// benches/fibonacci.rs

fn main() {
    // Run registered benchmarks.
    divan::main();
}

// Register a `fibonacci` function and benchmark it over multiple cases.
#[divan::bench(args = [1, 2, 4, 8, 16, 32])]
fn fibonacci(n: u64) -> u64 {
    if n <= 1 {
        1
    } else {
        fibonacci(n - 2) + fibonacci(n - 1)
    }
}

The divan::bench macro brings a very idiomatic and easy-to-use way to define and customize benchmarks. Bringing this closer to standard test definition while we're waiting on custom test frameworks to be stabilized.

Try it now by checking out our integration guide in the documentation to get started with using Divan in your Rust projects.

Read more

Dec 16, 2024

Improvements of the Benchmark and Branch pages

We released several improvements to the benchmark dashboard and branch pages.

Benchmark history graph

The performance of the benchmark history graph has been greatly improved. This improvement will be largely noticeable in projects with large histories. The vertical axis is now updated when zooming in on the graph, making it easier to see localized changes.

See it in action handling more than 15k data points:

Analyzing the results of a benchmark from the oxc project

Share a link to a specific benchmark

You can now copy a link to a specific benchmark from a Pull Request, a Run, or a custom comparison view. This link will take you directly to the benchmark within the report.

Here is an example:

Copying a benchmark URI from the swc project

Profiling data in the benchmark dashboard

On the benchmark dashboard, you can now see the benchmark flame graph, computed from the latest run on the default branch.

Read more

Nov 29, 2024

Launch Week #1

Advent of CodSpeed

Advent of CodSpeed

We're excited to announce the launch of CodSpeed's Advent Calendar, a performance-focused coding challenge based on the popular Advent of Code problems! 🎄

The challenge

  • Compete for Speed: Solve daily problems from Advent of Code and optimize for performance in Rust

  • Prizes: Stand a chance to win incredible prizes, including:

    • 🏆 MacBook Air
    • 🎮 Nintendo Switch
    • 🎧 Noise-canceling headphones
    • ⌨️ Mechanical keyboard
    • 🔊 JBL Flip 6
    • 💸 Steam gift cards
  • Leaderboard: Track your ranking as you climb to the top of this exciting global competition.

How to participate?

  • Write the fastest algorithms in Rust.
  • Submit your solutions via our GitHub repository
  • Earn points daily and aim for the top prizes!

Find more details on the Advent of CodSpeed page.

👾 Join our Discord to connect with other participants and stay updated.

Happy coding and may the fastest Rustacean win! 🦀✨

Read more

Nov 28, 2024

Launch Week #1

Compare Any Runs

Compare Any Runs

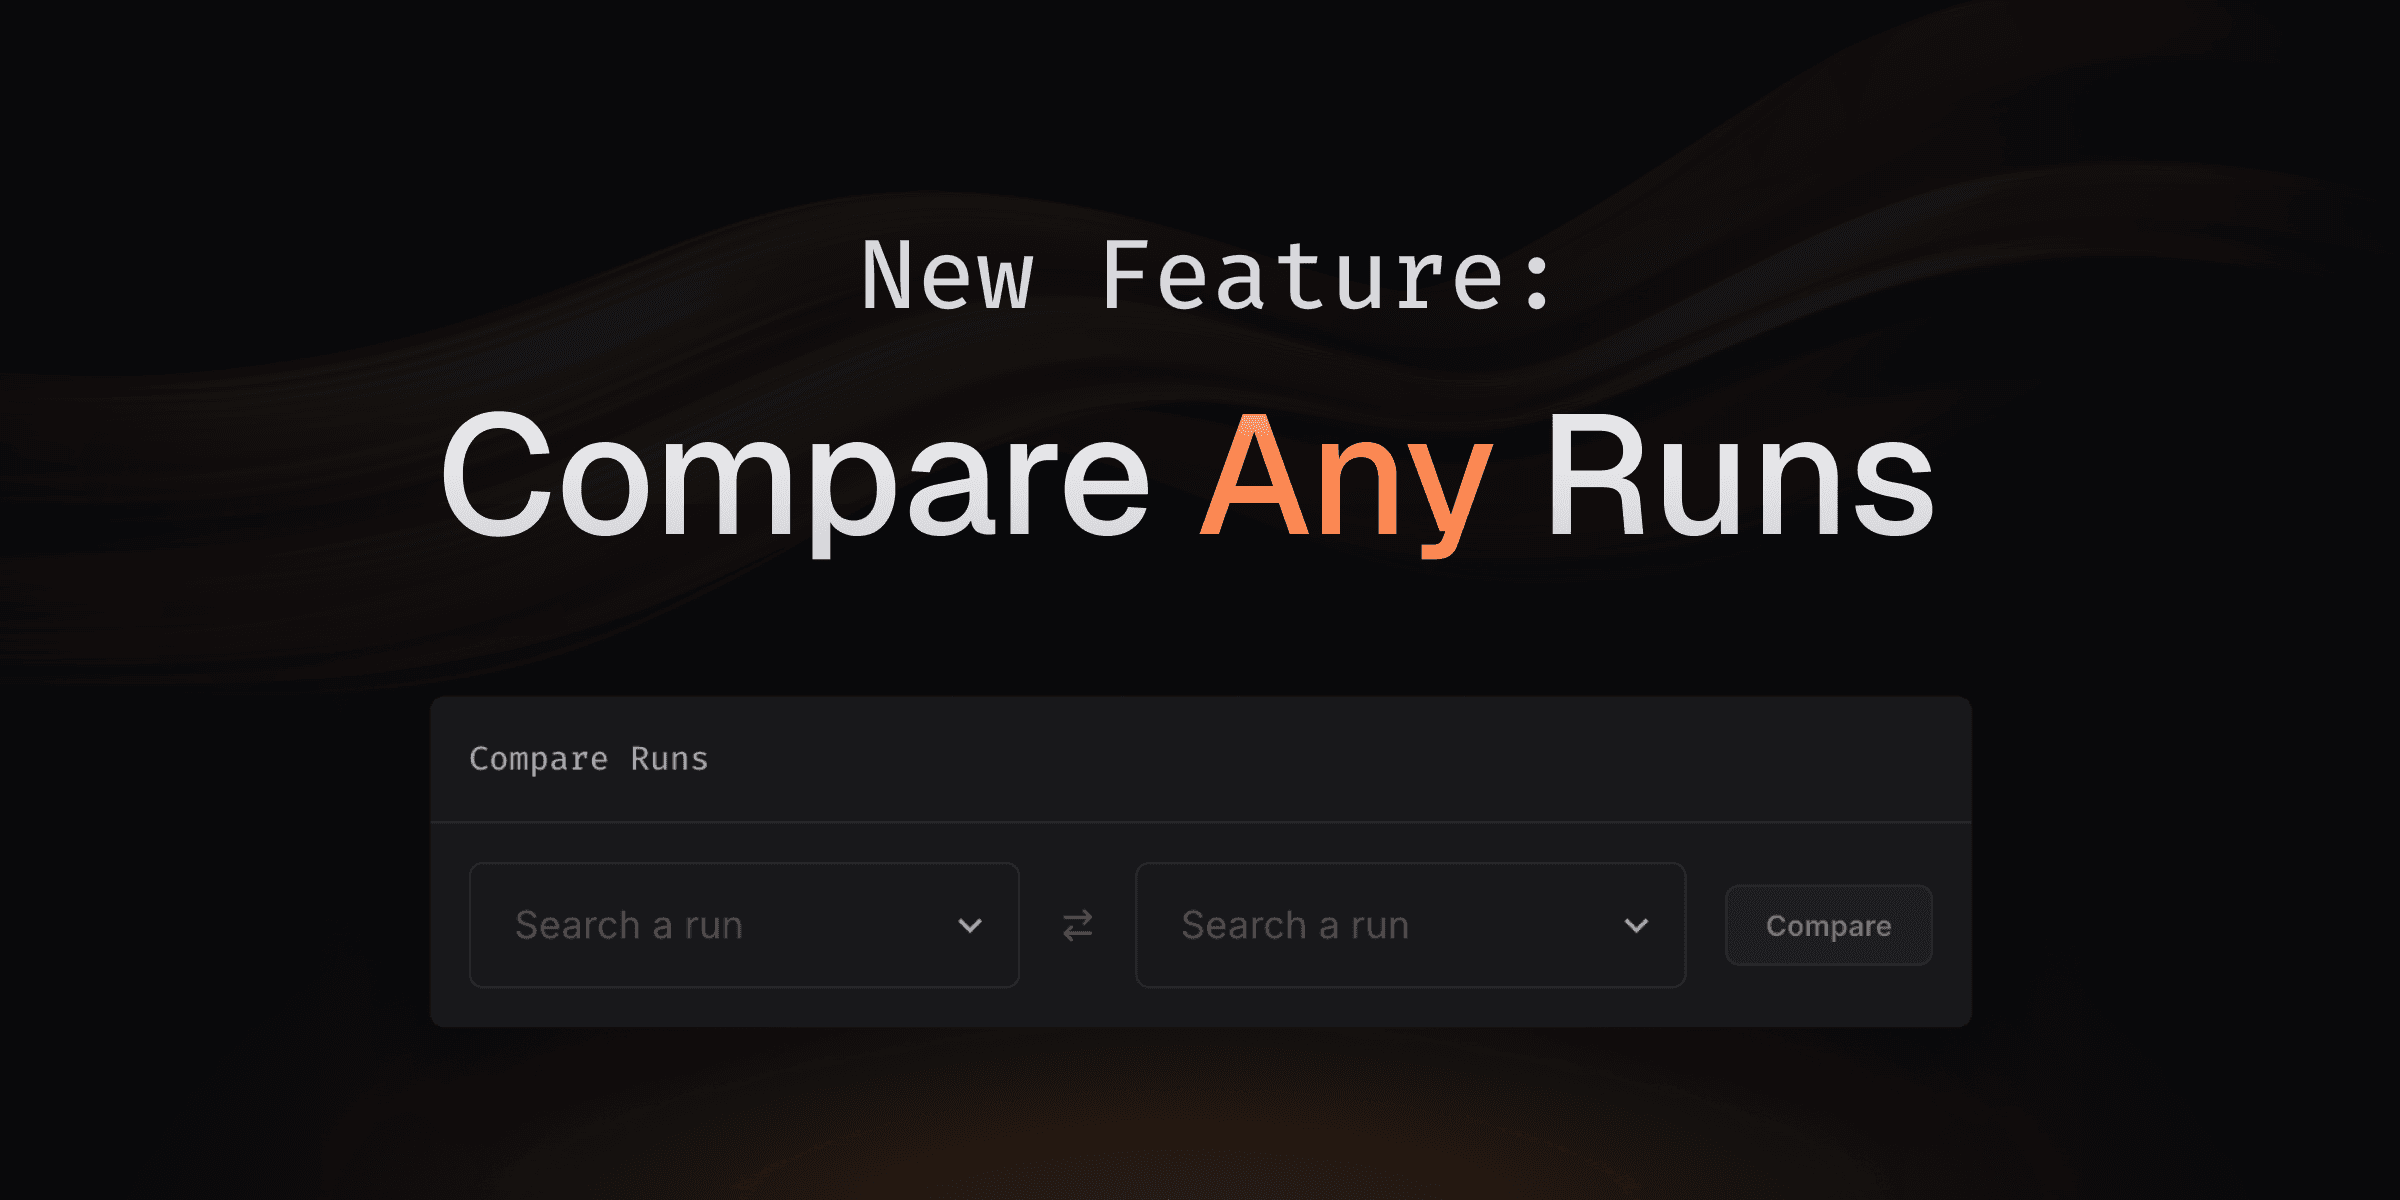
Until now, CodSpeed allowed you to compare runs only in specific scenarios—either through pull requests comparing branches with their base or comparing consecutive commits on a single branch.

With this new feature, you can now compare any runs: on arbitrary commits or branches, and also local runs made with the CLI.

Want to try it out? Just head to the "Runs" tab of a project (you can find a few of them here) and select the runs you want to compare!

Comparing astral-sh/ruff versions 0.7.4 and 0.8.1. Check it out here!

What's Next? 🚀

Soon, we'll be adding the ability to compare tags directly, making it even simpler to compare runs across different versions of your project. Stay tuned for more updates!

Read more

We handle performance, so you can focus on shipping.

Talk to our team about deployment, security, and scale; or start building today.