What is CPU Simulation?
CodSpeed instruments your benchmarks to measure the performance of your code, simulating the CPU behavior. A benchmark will be run only once and the CPU behavior will be simulated. This ensures that the measurement is as accurate as possible, taking into account not only the instructions executed but also the cache and memory access patterns. The simulation gives us an equivalent of the CPU cycles that includes cache and memory access.Estimating Cycles
The CPU simulation takes into account the following factors:- Executed instructions (
Ir): the baseline cost of your code - L1 cache misses: data that must be fetched from L2/L3 cache, this can take 10-40 cycles
- LL (Last-level) cache misses: data that must be fetched from RAM, this can take 100+ cycles
Converting Cycles to Time
Once we have the number of cycles for a benchmark, we transform it into an execution time measurement by using the following formula, whereFREQUENCY is
a constant set to the frequency (number of instructions executed per second) of
a real CPU:
We then calculate the execution speed of the benchmark by taking the inverse
of the execution time:
This is the displayed metric in the CodSpeed reports.
Why choose execution speed over execution time?A performance increase of a benchmark will increase its execution speed. Same
for a performance regression. However, if execution time was used, a performance
increase of a benchmark would result in a decrease in its execution time. This
would be counter-intuitive.
System Calls
System calls play a critical role in the performance of software, but they present unique challenges for accurate measurement. A system call is a request made by a program to the operating system’s kernel, typically for I/O operations such as reading from or writing to files, communicating over a network, or interacting with hardware devices. Due to their nature, system calls introduce variability in execution time. This variability is influenced by several factors, including system load, network latency, and disk I/O performance. As a result, the execution time of system calls can fluctuate significantly, making them the most inconsistent part of a program’s execution time. To ensure that our execution speed measurements are as stable and reliable as possible, CodSpeed CPU Simulation mode does not include system calls in the measurement. Instead, we focus solely on the code executed within user space(the code you wrote), excluding any time spent in system calls. This approach allows us to provide a clear and consistent metric for the execution speed of your code, independent of your hardware and all variability that it can create. Still, the wall time spent on system calls is recorded and this data is available in the trace view, providing insight into how much time is consumed by system interactions. While these times are not included in the overall execution speed metric, they offer valuable information for performance analysis.Roadmap for system callsIn the future, we plan to enhance CodSpeed by emulating system calls. This will
allow us to more accurately anticipate the performance impact of system calls,
further improving the reliability and comprehensiveness of our performance
measurements.
Legacy Terminology
Previously, this instrument was referred to as “instrumentation” or “instrumentation mode”. This terminology is being phased out in favor of “CPU simulation” to better reflect what the instrument does: simulating CPU behavior. While the oldinstrumentation value is still accepted for backward compatibility, it will be
removed in a future release.
We recommend updating your configuration and your integration library to use
simulation instead.
Going forward, what we will refer to as “instrumentation” represents the
generic overlay that CodSpeed applies to your benchmarks to collect
performance data and profiling information.It applies to both CPU Simulation and Walltime instruments.
Automated Profiling
When using the CPU simulation instrument, CodSpeed automatically collects profiling data and generates flame graphs for each benchmark when available. This allows you to quickly identify performance bottlenecks and their root causes.Pre-requisites
To enable profiling with the CPU simulation instrument, ensure you meet the following minimum version requirements:- Node.js: Node 16 or higher, and the following minimum versions of the integrations
- Python: Python 3.12 or higher and
pytest-codspeed>=2.0.0 - Rust: Profiling is enabled by default with any version of the integration library
- C++: Profiling is enabled by default with any version of the integration library
Inspector Metrics
When you hover over a span in the flame graph, the inspector displays CPU simulation-specific metrics: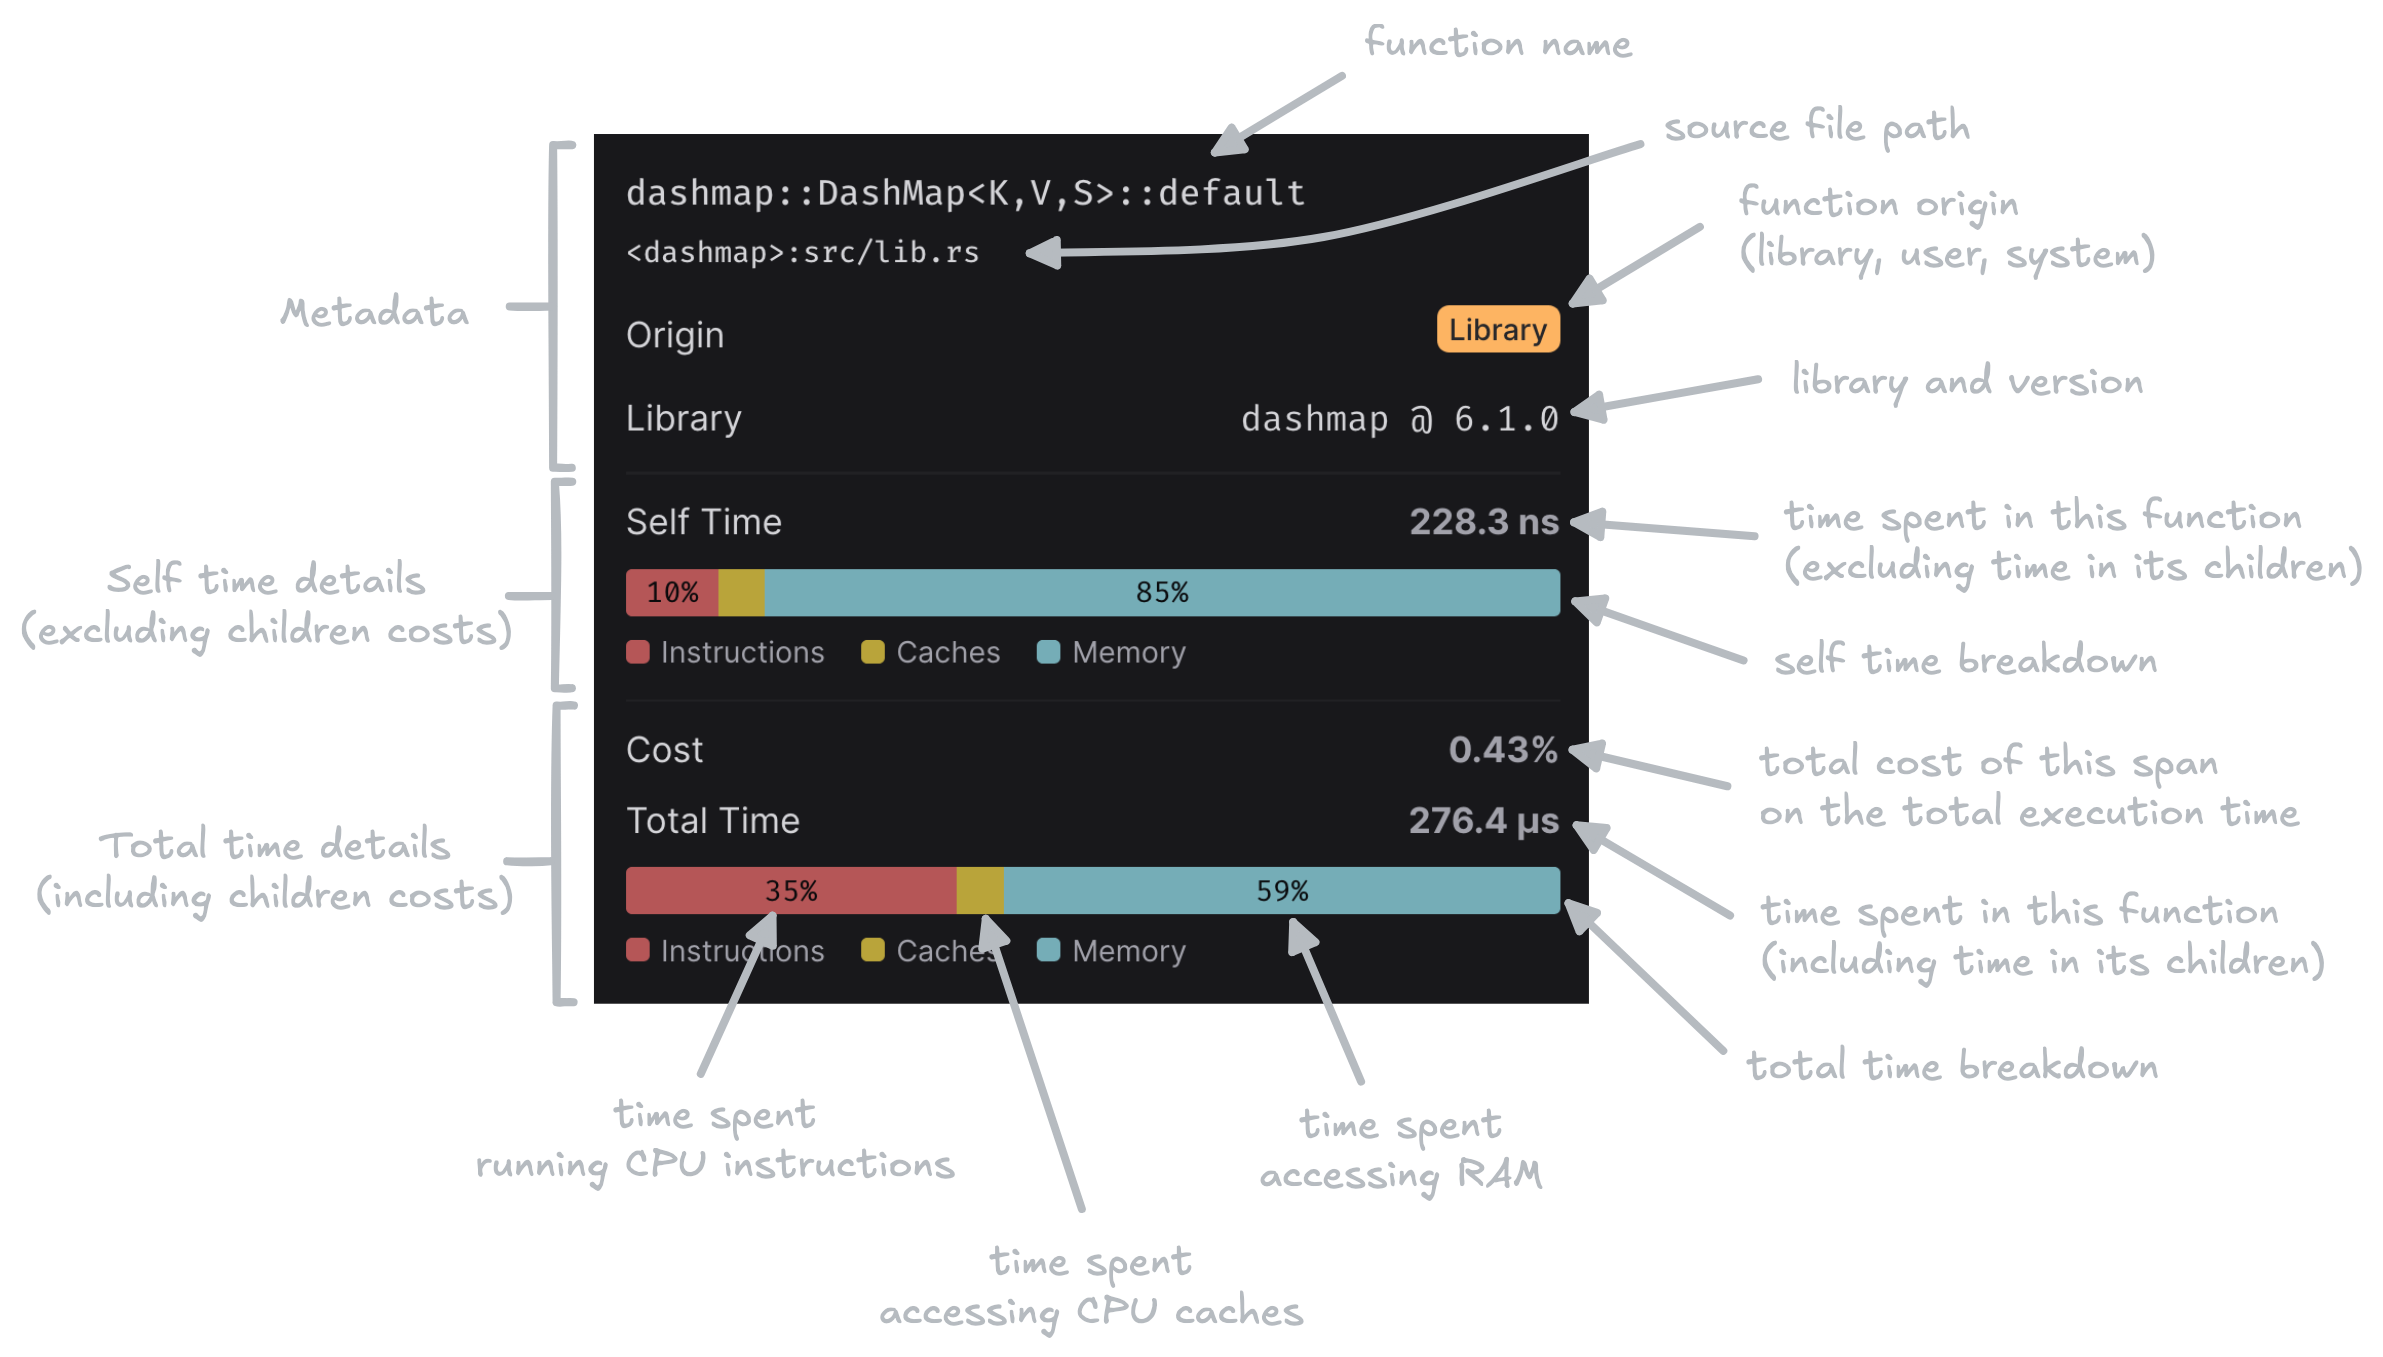
- Self time: The simulated execution time spent in the function body only, excluding time spent in child function calls.
- Total time: The simulated execution time spent in the function including all its children.
- Instructions: Time spent executing CPU instructions.
- Cache: Time spent due to CPU cache misses (L1, L2, L3).
- Memory: Time spent waiting for main memory access.
Usage with GitHub Actions
To enable CPU Simulation in your GitHub Actions workflow, ensure you are usingmode: simulation in the CodSpeed Action configuration.
Next Steps
Profiling
Learn how to read flame graphs and use profiling to optimize your code
Unexpected Regressions
Understand why benchmarks can regress without code changes
Walltime Instrument
Measure real-world execution time including system calls and I/O