This article explains regressions in micro-benchmarks, caused by different cache behavior. These regressions are typically < 1μs, which is why they are often not noticeable in walltime measurements.
Toolchain Updates
It is generally recommended to pin your toolchain (e.g. compilers, dependencies, etc.) to avoid unintended changes, which can be bugs, malware but also performance regressions. Common issues:- Stable compiler toolchains: Using
dtolnay/rust-toolchain@stablein Github Actions is non-deterministic. When Rust stable updates (e.g. from 1.92 to 1.93), your toolchain and Rust compiler will update, which can change compiler optimizations. - CI runner/image updates:
runs-on: ubuntu-latestcan move to a new Ubuntu release, changing glibc, LLVM, and other system libraries. - Dependency updates: Changes in
Cargo.lock(new crate versions) or JS/Python lockfiles can alter inlining decisions and code layout. - Target architecture changes: Compiling for different CPU
microarchitectures (e.g.
x86-64-v2vsx86-64-v3vsx86-64-v4) enables different instruction sets (SSE, AVX, AVX-512).
latest or stable tags and use a specific
version instead. Commit your lockfiles to version control to ensure reproducible
builds.
CI Runner Variability
Shared CI runners (GitHub Actions, GitLab CI) don’t guarantee the same physical machine between jobs. The base and head runs can end up on different hardware:- CPU model: Different instruction sets, cache sizes, and microarchitectures change simulated cache behavior.
- System libraries: Library versions can differ even on the same OS image if it was updated between runs.
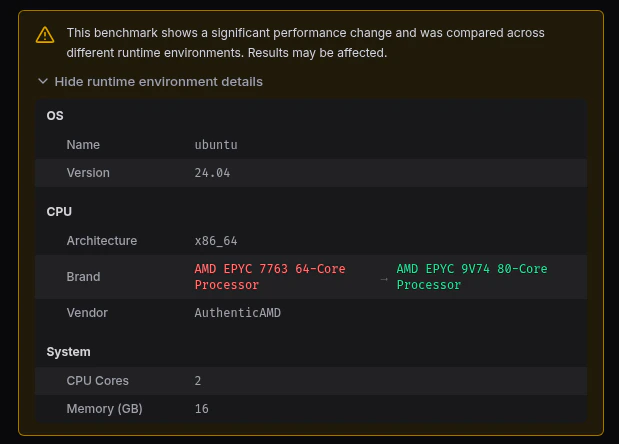
The runtime environment details show which fields differ between the base and head runs
Compiler Non-determinism
When can this happen? Any change to the code or compiler can trigger different compiler decisions. However, recompiling the entire codebase with the same source code, compiler version, and flags is usually deterministic. Compiling optimized code is hard, because it is a tradeoff between compilation resource usage (speed, memory, …), runtime execution speed and binary size, because you don’t want your simple code to take 1 hour to compile or take up 1GB of disk space. This tradeoff is balanced by using heuristics and thresholds, that cover most cases while being fast enough. An example for this is inlining: By inlining a function, the overhead of a call at runtime is removed and also allows the compiler to better optimize the function body. However, if every function is inlined the binary would be much bigger, which decreases the performance due to the increased instruction cache pressure. There are many other optimizations that can affect cache behavior:- Basic block reordering: Moving cold error paths into separate functions,
rearranging
ifbranches, … - Loop transformations: Loop unrolling, peeling, fusing, …
- Bounds checks: Compilers are often smart enough to eliminate bounds checks, but if they are not, they may hinder loop unrolling/vectorization.
Function Alignment
Do you think this function always has the same performance?foo
function, the CPU may need to fetch another cache line to get the instructions
after the jmp label instruction. This is counted as an instruction cache miss,
which may cost anywhere from 10-40 cycles (if found in L2/L3) to 100+ cycles (if
it goes all the way to RAM).
Because of that, compilers try to align functions and keep the hot paths close
to each other to minimize cache misses.
Allocators
Most allocators are designed to be fast, while keeping fragmentation and memory usage at a minimum. Just like compilers, they use heuristics to decide when to allocate more memory, which can lead to unpredictable performance. Here are some examples that can cause different performance:- Time-Based Memory Decay: Allocators like jemalloc implement “decay” logic, where unused “dirty” memory pages are returned to the OS after a specific duration (e.g., 10 seconds).
- Adaptive Thread-Cache Sizing: High-performance allocators (like tcmalloc) dynamically resize thread-local caches based on “demand history.”
- Memory Fragmentation Patterns: Allocation order determines fragmentation. If one benchmark allocates 1MB while another allocates 64B, then the allocator may have to allocate more memory to satisfy the larger request, leading to fragmentation.
HashMaps
Most hash map implementations randomize their hash seed on every program start. Rust’sstd::collections::HashMap, Python’s dict, and Go’s map all do this
by default. The reason is security: a fixed seed lets an attacker craft inputs
that all hash to the same bucket, turning O(1) lookups into O(n) and creating a
denial-of-service vector (HashDoS).
For a benchmark, that randomization shows up as run-to-run variance even when
the input is identical:
- Bucket layout: Keys land in different buckets between runs. Probe sequences differ, which changes the cache lines touched on each lookup.
- Iteration order: Iterating a
HashMapproduces a different order on every run, so any work that depends on iteration order (allocations, recursive calls, downstream hashing) takes a different path. - Resize timing: With a different bucket distribution, the map hits its load-factor threshold at a different insertion, shifting where the next allocation happens and how big the peak working set gets.
BTreeMap if iteration
order matters.
Filesystem Iteration Order
Reading a directory on Linux using (e.g. usingreaddir, or libraries
built on top of it) does not return entries in any particular order. The reason
for this is that the underlying implementations vary based on the filesystem
(ext4, btrfs, xfs all behave differently). This means that the benchmarks can be
fully deterministic when run on a single machine (and therefore the same
filesystem), but show significant variance when run on different filesystems.
Changes in the filesystem iteration order can have an impact on:
- Cache behavior: Files get processed in a different order, so the data loaded into the page cache and the CPU caches differs between runs.
- Allocation order: When per-file work allocates, the allocator sees a different request sequence. Peak memory and fragmentation change even though the total work is identical.
- Order-dependent code: Anything downstream that consumes the iteration order (sorting later, hashing into a map, writing output) takes a different path.
Next Steps
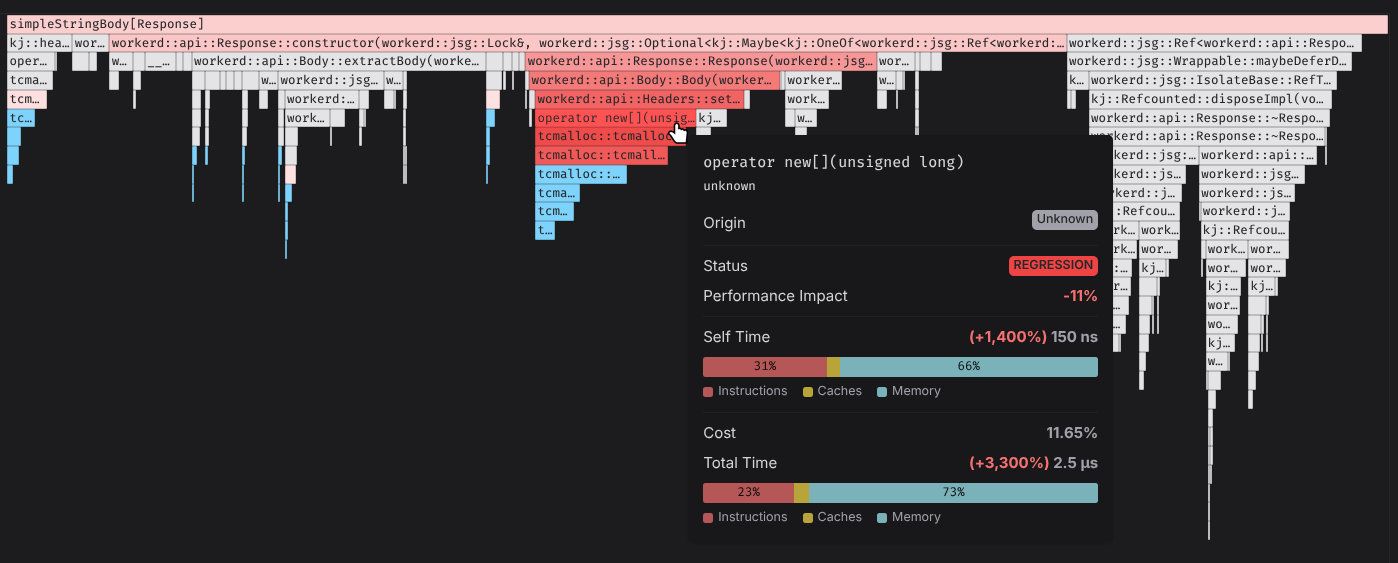
Now that you understand the common causes of benchmark regressions, you can use CodSpeed’s profiling tools to identify them in your code.Profiling
Learn how to read flamegraphs and find performance bottlenecks
Reducing Variance
Learn strategies to reduce variance in your benchmarks