This guide uses
pytest-codspeed because it
integrates seamlessly with pytest, the most
popular Python testing framework. Your benchmarks live right alongside your
tests using the same familiar syntax, no separate infrastructure to maintain.Plus, all of pytest’s ecosystem (parametrization, fixtures, plugins) works
seamlessly with your benchmarks. You can even turn existing tests into
benchmarks by adding a single decorator.
If you’re wondering whether to use command-line tools like time or
hyperfine versus integrated frameworks like pytest-codspeed, check out our
Choosing the Right Python Benchmarking Strategy
guide for a
detailed comparison.
First, add pytest-codspeed to your project’s dependencies using
uv:
uv add --dev pytest-codspeed
Don’t have uv?You can use pip install pytest-codspeed instead. uv is a modern, fast Python
package manager that we recommend for new projects, but any package manager
works fine.
import pytest# Define the function we want to benchmarkdef fibonacci(n: int) -> int: if n <= 1: return n else: return fibonacci(n - 2) + fibonacci(n - 1)# Register a simple benchmark using the pytest marker@pytest.mark.benchmarkdef test_fib_bench(): result = fibonacci(30) assert result == 832040
A few things to note: @pytest.mark.benchmark is a standard
pytest marker that marks
this test as a benchmark. The entire test function is measured, including both
the computation and the assertion. It’s a regular pytest test, so you can run
it with pytest as usual. The test validates correctness (via assertions) and
tracks performance at the same time.
What does --codspeed do?This flag activates CodSpeed’s benchmarking engine to collect performance
measurements. Without it, pytest runs your tests normally without gathering
performance data. If you’re not using uv, run pytest tests/ --codspeed
instead.
You should see output like this:
terminal
=============================== test session starts ===============================platform darwin -- Python 3.13.3, pytest-8.4.2, pluggy-1.6.0codspeed: 4.2.0 (enabled, mode: walltime, callgraph: not supported, timer_resolution: 41.7ns)CodSpeed had to disable the following plugins: pytest-benchmarkbenchmark: 5.2.1 (defaults: timer=time.perf_counter disable_gc=False min_rounds=5 min_time=0.000005 max_time=1.0 calibration_precision=10 warmup=False warmup_iterations=100000)rootdir: /Users/user/projects/CodSpeedHQ/docs-guides/pythonconfigfile: pyproject.tomlplugins: benchmark-5.2.1, codspeed-4.2.0collected 1 itemtests/test_benchmarks.py . [100%] Benchmark Results┏━━━━━━━━━━━━━━━━┳━━━━━━━━━━━━━┳━━━━━━━━━━━━━┳━━━━━━━━━━┳━━━━━━━┓┃ Benchmark ┃ Time (best) ┃ Rel. StdDev ┃ Run time ┃ Iters ┃┡━━━━━━━━━━━━━━━━╇━━━━━━━━━━━━━╇━━━━━━━━━━━━━╇━━━━━━━━━━╇━━━━━━━┩│ test_fib_bench │ 73.1ms │ 2.1% │ 2.96s │ 40 │└────────────────┴─────────────┴─────────────┴──────────┴───────┘================================== 1 benchmarked ================================================================== 1 passed in 4.09s ================================
The output shows that test_fib_bench takes about 73 milliseconds to compute
fibonacci(30). It ran 40 times in 2.96 seconds to get a reliable measurement.
Understanding the results:
Time (best): The fastest single iteration - this is your function’s
performance (lower is better).
Rel. StdDev: Relative standard deviation - measures consistency between
runs (lower means more reliable results).
Run time: Total time spent running the benchmark.
Iters: How many times your code ran - automatically adjusted based on
speed (fast code runs more times for accuracy).
So far, we’ve only tested our function with a single input value (30). But what
if we want to see how performance changes with different input sizes? This is
where pytest’s
@pytest.mark.parametrize
comes in, and it works seamlessly with benchmarks.Let’s update our benchmark to test multiple input sizes:
tests/test_benchmarks.py
@pytest.mark.benchmark@pytest.mark.parametrize("n", [5, 10, 15, 20, 30])def test_fib_parametrized(n): result = fibonacci(n) assert result > 0
When you run this benchmark, pytest will create separate test instances for each
parameter value, allowing you to compare performance across different inputs:
Notice how parametrization creates five separate benchmarks, one for each input
value. The results reveal the exponential time complexity of our recursive
Fibonacci implementation: fibonacci(5) takes virtually no time (0ns) and runs
over 1 million iterations, while fibonacci(30) takes 72.9ms and runs only 40
times. This dramatic difference (from nanoseconds to milliseconds) demonstrates
how quickly recursive Fibonacci becomes expensive as the input grows.
You can also benchmark across multiple dimensions:
tests/test_benchmarks.py
def fibonacci_iterative(n: int) -> int: if n <= 1: return 1 a, b = 1, 1 for _ in range(n - 1): a, b = b, a + b return b@pytest.mark.benchmark@pytest.mark.parametrize("algorithm, n", [ ("recursive", 10), ("recursive", 20), ("iterative", 100), ("iterative", 200),])def test_fib_algorithms(algorithm, n): if algorithm == "recursive": result = fibonacci(n) else: result = fibonacci_iterative(n) assert result > 0
This benchmark creates four separate test cases, one for each combination of
algorithm and input size. The output clearly shows the dramatic performance
difference between the two implementations: the iterative version handles much
larger inputs (100, 200) in virtually no time, while the recursive version takes
8.49µs for n=20. Notice how fibonacci_iterative(200) runs over 500,000
iterations in the same time budget that fibonacci(20) only manages about
5,000.Parametrization makes algorithmic trade-offs visible at a glance, helping you
choose the most efficient implementation for your use case.
By default, pytest generates benchmark names from the parameter values. That
works well for primitives like numbers or short strings, e.g.,
test_fib_parametrized[5]. With richer parameters such as dictionaries, lists,
or callable objects, the auto-generated names degrade into opaque labels like
test_my_bench[param0-param1]. They are hard to read, and if the underlying
values change between runs, CodSpeed treats each case as a new benchmark and
loses the historical comparison.Use the ids argument to attach a stable, descriptive label to each case:
tests/test_benchmarks.py
@pytest.mark.benchmark@pytest.mark.parametrize( "n", [5, 10, 15, 20, 30], ids=["tiny", "small", "medium", "large", "huge"],)def test_fib_named(n): result = fibonacci(n) assert result > 0
The benchmark output now reads test_fib_named[tiny] through
test_fib_named[huge], which is easier to scan and stays stable even if you
tweak the parameter values later.For finer-grained control, wrap individual cases in pytest.param to attach an
id one at a time:
This form is especially useful when parameters are dictionaries, dataclass
instances, or other non-trivial objects that pytest cannot turn into readable
ids on its own.pytest.param also works with multiple parameters. Pass one positional value
per name in the parametrize declaration, then attach a single id that
describes the whole case:
tests/test_benchmarks.py
@pytest.mark.benchmark@pytest.mark.parametrize( "algorithm, n", [ pytest.param("recursive", 10, id="recursive-small"), pytest.param("recursive", 20, id="recursive-large"), pytest.param("iterative", 100, id="iterative-small"), pytest.param("iterative", 200, id="iterative-large"), ],)def test_fib_algorithms(algorithm, n): if algorithm == "recursive": result = fibonacci(n) else: result = fibonacci_iterative(n) assert result > 0
The output now reads test_fib_algorithms[recursive-small] instead of the
default test_fib_algorithms[recursive-10], so the benchmark name stays stable
even if you later change 10 to 15 to keep run times in a useful range.
Pick ids that describe the scenario, not the raw value. ["cold-cache", "warm-cache"] tells you more about what is being measured than [0, 1], and
it stays meaningful when the underlying values change.
Sometimes, you have expensive setup that shouldn’t be included in your benchmark
measurements. For example, generating large datasets, creating complex data
structures, or preparing test data. This is where the benchmarkfixture comes in.The benchmark fixture gives you precise control over what gets measured. Let’s
benchmark a data analysis function that identifies outliers in numerical data.
The expensive part is generating the test dataset, but we only want to measure
the outlier detection algorithm:
tests/test_outlier_detection.py
import pytestimport randomdef generate_dataset(size: int) -> list[float]: """Generate a large dataset with some outliers (expensive operation).""" random.seed(42) # Fixed seed for reproducibility data = [] for _ in range(size): # 95% normal values from a normal distribution if random.random() < 0.95: data.append(random.gauss(100.0, 15.0)) else: # 5% outliers data.append(random.uniform(200.0, 300.0)) return datadef detect_outliers(data: list[float], threshold: float = 2.0) -> list[int]: """Detect outliers using z-score method (what we want to benchmark).""" # Calculate mean mean = sum(data) / len(data) # Calculate standard deviation variance = sum((x - mean) ** 2 for x in data) / len(data) std_dev = variance ** 0.5 # Find outliers outliers = [] for i, value in enumerate(data): z_score = abs((value - mean) / std_dev) if std_dev > 0 else 0 if z_score > threshold: outliers.append(i) return outliers# Benchmark for dataset generation@pytest.mark.benchmark@pytest.mark.parametrize("size", [10_000, 100_000, 1_000_000])def test_generate_dataset(size): generate_dataset(size)# Benchmark for outlier detection only@pytest.mark.parametrize("size", [10_000, 100_000, 1_000_000])def test_outlier_detection(benchmark, size): # NOT MEASURED: Expensive setup - generate large dataset dataset = generate_dataset(size) # MEASURED: Only the outlier detection algorithm result = benchmark(detect_outliers, dataset) # NOT MEASURED: Assertions assert len(result) > 0 # We should find some outliers assert all(isinstance(idx, int) for idx in result)
The setup code (generating the dataset) runs once, and only the
detect_outliers() call inside benchmark() is measured. This gives you
accurate performance data without the noise of test setup.Run this benchmark by filtering the pytest command to this file:
uv run pytest tests/test_outlier_detection.py --codspeed
The results reveal a crucial insight about what we’re actually measuring. Notice
the dramatic difference between the two benchmark groups:Dataset generation (test_generate_dataset):
10k elements: 124.29µs
100k elements: 11.0ms (88x slower)
1M elements: 225.5ms (1,814x slower than 10k)
Outlier detection (test_outlier_detection):
10k elements: 46.01µs
100k elements: 3.3ms (72x slower)
1M elements: 132.4ms (2,878x slower than 10k)
This comparison shows that for the 1M element dataset, dataset generation
takes 225.5ms while outlier detection takes 132.4ms, the setup is actually
slower than the algorithm we want to measure.Without using the benchmark fixture to exclude the setup, our measurements
would include both operations, making it impossible to understand the true
performance of the outlier detection algorithm.The benchmark fixture ensures we measure only what matters: the algorithm
itself, not the test infrastructure around it.
If you have a dedicated benchmarks file, you can mark all tests as benchmarks at
once using pytest’s module-level marking:
tests/benchmarks/test_math_operations.py
import pytest# Mark all tests in this module as benchmarkspytestmark = pytest.mark.benchmarkdef test_sum_squares(): # MEASURED: Everything in this test result = sum(i**2 for i in range(1000)) assert result > 0def test_sum_cubes(): # MEASURED: Everything in this test result = sum(i**3 for i in range(1000)) assert result > 0
Now all tests in this file are automatically benchmarked without individual
decorators. This is useful for benchmark-specific test files.
For maximum control over your benchmarks, use
benchmark.pedantic().
This allows you to specify custom setup and teardown functions, control the
number of rounds and iterations, configure warmup behavior, and more:
tests/test_advanced.py
import jsonimport pytestdef parse_json_data(json_string: str) -> dict: """Parse JSON string into a dictionary.""" return json.loads(json_string)@pytest.mark.parametrize("size", [10_000, 30_000])def test_json_parsing(benchmark, size): # NOT MEASURED: Setup to create test data items = [{"id": i, "name": f"item_{i}", "value": i * 10} for i in range(size)] json_string = json.dumps(items) # MEASURED: Only the parse_json_data() function result = benchmark.pedantic( parse_json_data, # Function to benchmark args=(json_string,), # Arguments to the function rounds=100, # Number of benchmark rounds iterations=10, # Iterations per round warmup_rounds=2 # Warmup rounds before measuring ) # NOT MEASURED: The assertion assert len(result) == size
Here is the output when you run this benchmark:
terminal
=============================== test session starts ===============================platform darwin -- Python 3.13.3, pytest-8.4.2, pluggy-1.6.0codspeed: 4.2.0 (enabled, mode: walltime, callgraph: not supported, timer_resolution: 41.7ns)CodSpeed had to disable the following plugins: pytest-benchmarkbenchmark: 5.2.1 (defaults: timer=time.perf_counter disable_gc=False min_rounds=5 min_time=0.000005 max_time=1.0 calibration_precision=10 warmup=False warmup_iterations=100000)rootdir: /Users/user/projects/CodSpeedHQ/docs-guides/pythonconfigfile: pyproject.tomlplugins: benchmark-5.2.1, codspeed-4.2.0collected 2 itemstests/test_advanced.py .. [100%] Benchmark Results┏━━━━━━━━━━━━━━━━━━━━━━━━━━┳━━━━━━━━━━━━━┳━━━━━━━━━━━━━┳━━━━━━━━━━┳━━━━━━━┓┃ Benchmark ┃ Time (best) ┃ Rel. StdDev ┃ Run time ┃ Iters ┃┡━━━━━━━━━━━━━━━━━━━━━━━━━━╇━━━━━━━━━━━━━╇━━━━━━━━━━━━━╇━━━━━━━━━━╇━━━━━━━┩│ test_json_parsing[10000] │ 294.85µs │ 0.9% │ 2.99s │ 1,000 ││ test_json_parsing[30000] │ 973.01µs │ 0.7% │ 9.88s │ 1,000 │└──────────────────────────┴─────────────┴─────────────┴──────────┴───────┘================================== 2 benchmarked ================================================================= 2 passed in 13.20s ================================
We can see that as expected each benchmark ran 100 rounds of 10 iterations each,
totalling 1,000 iterations.Using benchmark.pedantic() is especially useful for bigger benchmarks where
you need precise control over rounds, iterations, and warmup behavior.
To benchmark asynchronous functions, we can use the benchmark fixture along
with asyncio.run() on a synchronous sub-function that calls our async code.
Here’s an example:
tests/test_async.py
import asyncioimport pytestasync def simple_async_task() -> int: """A simple async task that simulates work""" await asyncio.sleep(0.1) # simulates async work for 100 ms return 42@pytest.mark.benchmarkdef test_simple_async_task(benchmark): """Benchmark a simple async task""" result = benchmark(lambda: asyncio.run(simple_async_task())) assert result == 42
Here is the output when you run this benchmark:
terminal
=============================== test session starts ===============================platform darwin -- Python 3.13.3, pytest-8.4.2, pluggy-1.6.0codspeed: 4.2.0 (enabled, mode: walltime, callgraph: not supported, timer_resolution: 41.7ns)CodSpeed had to disable the following plugins: pytest-benchmarkbenchmark: 5.2.1 (defaults: timer=time.perf_counter disable_gc=False min_rounds=5 min_time=0.000005 max_time=1.0 calibration_precision=10 warmup=False warmup_iterations=100000)rootdir: /Users/user/projects/CodSpeedHQ/docs-guides/pythonconfigfile: pyproject.tomlplugins: benchmark-5.2.1, codspeed-4.2.0collected 1 itemtests/test_async.py . [100%] Benchmark Results┏━━━━━━━━━━━━━━━━━━━━━━━━┳━━━━━━━━━━━━━┳━━━━━━━━━━━━━┳━━━━━━━━━━┳━━━━━━━┓┃ Benchmark ┃ Time (best) ┃ Rel. StdDev ┃ Run time ┃ Iters ┃┡━━━━━━━━━━━━━━━━━━━━━━━━╇━━━━━━━━━━━━━╇━━━━━━━━━━━━━╇━━━━━━━━━━╇━━━━━━━┩│ test_simple_async_task │ 100.8ms │ 1.0% │ 2.95s │ 29 │└────────────────────────┴─────────────┴─────────────┴──────────┴───────┘================================== 1 benchmarked ================================================================== 1 passed in 4.12s ================================
Since asynchronous functions most likely involve I/O operations, their execution
time can vary significantly based on external factors like network latency or
disk speed. When benchmarking async code, consider running more iterations or
rounds to obtain reliable measurements.If you are using CodSpeed in your CI to run your benchmarks, be sure to use the
Walltime instrument to get accurate timing for async
operations.
Since benchmarks are regular pytest tests, they should include assertions to
verify correctness:
# ❌ BAD: No verification@pytest.mark.benchmarkdef test_computation(): result = expensive_computation() # Oops, forgot to check if result is correct!# ✅ GOOD: Verify the result without measuring the assertiondef test_computation(benchmark): result = benchmark(expensive_computation) assert result == expected_value
This ensures you’re benchmarking correct code, not broken code that happens to
be fast.Or, as we briefly said in the introduction, you can turn existing tests into
benchmarks by adding the @pytest.mark.benchmark decorator.
# Existing correctness testdef test_sorting_algorithm(): data = [5, 2, 9, 1] result = sorting_algorithm(data) assert result == [1, 2, 5, 9]# Turn it into a benchmark using the benchmark fixturedef test_sorting_algorithm(benchmark): data = [5, 2, 9, 1] result = benchmark(sorting_algorithm, data) assert result == [1, 2, 5, 9]
Your benchmarks should produce consistent results across runs:
# ❌ BAD: Non-deterministic due to random datadef test_sort_random(benchmark): import random data = [random.randint(1, 1000) for _ in range(100)] benchmark(sorted, data)# ✅ GOOD: Use a fixed seed or deterministic datadef test_sort_deterministic(benchmark): import random random.seed(42) # Fixed seed for reproducibility data = [random.randint(1, 1000) for _ in range(100)] benchmark(sorted, data)# ✅ EVEN BETTER: Use deterministic datadef test_sort_worst_case(benchmark): data = list(range(100, 0, -1)) # Always the same benchmark(sorted, data)
def quick_sort(arr: list[int]) -> list[int]:
    if len(arr) <= 1:
        return arr
    pivot = arr[len(arr) // 2]
    left = [x for x in arr if x < pivot]
    middle = [x for x in arr if x == pivot]
    right = [x for x in arr if x > pivot]
    return quick_sort(left) + middle + quick_sort(right)
Then benchmark it in your tests:
tests/benchmarks/test_algorithm_performance.py
from mylib.algorithms import quick_sortimport pytest@pytest.mark.parametrize("size", [10, 100, 1000])def test_quick_sort_performance(benchmark, size): # NOT MEASURED: Create test data data = list(range(size, 0, -1)) # MEASURED: The sorting algorithm result = benchmark(quick_sort, data) # NOT MEASURED: Verify correctness assert result == list(range(1, size + 1))
Make sure your package is installed in development mode:
Here’s how to integrate CodSpeed with your pytest-codspeed benchmarks:
1
Set Up GitHub Actions
Create a workflow file to run benchmarks on every push and pull request.
.github/workflows/codspeed.yml
name: CodSpeed Benchmarkson: push: branches: - "main" # or "master" pull_request: # `workflow_dispatch` allows CodSpeed to trigger backtest # performance analysis in order to generate initial data. workflow_dispatch:jobs: benchmarks: name: Run benchmarks runs-on: ubuntu-latest permissions: # optional for public repositories contents: read # required for actions/checkout id-token: write # required for OIDC authentication with CodSpeed steps: - uses: actions/checkout@v5 - name: Install uv uses: astral-sh/setup-uv@v7 - name: Set up Python uses: actions/setup-python@v6 with: python-version: '3.13' - name: Install dependencies run: uv sync --all-extras --dev - name: Run the benchmarks uses: CodSpeedHQ/action@v5 with: mode: simulation run: uv run pytest tests/ --codspeed
Important: Use actions/setup-python to set up Python, not uv install.
This is required for CodSpeed’s CPU simulation to work correctly.
2
Check the Results
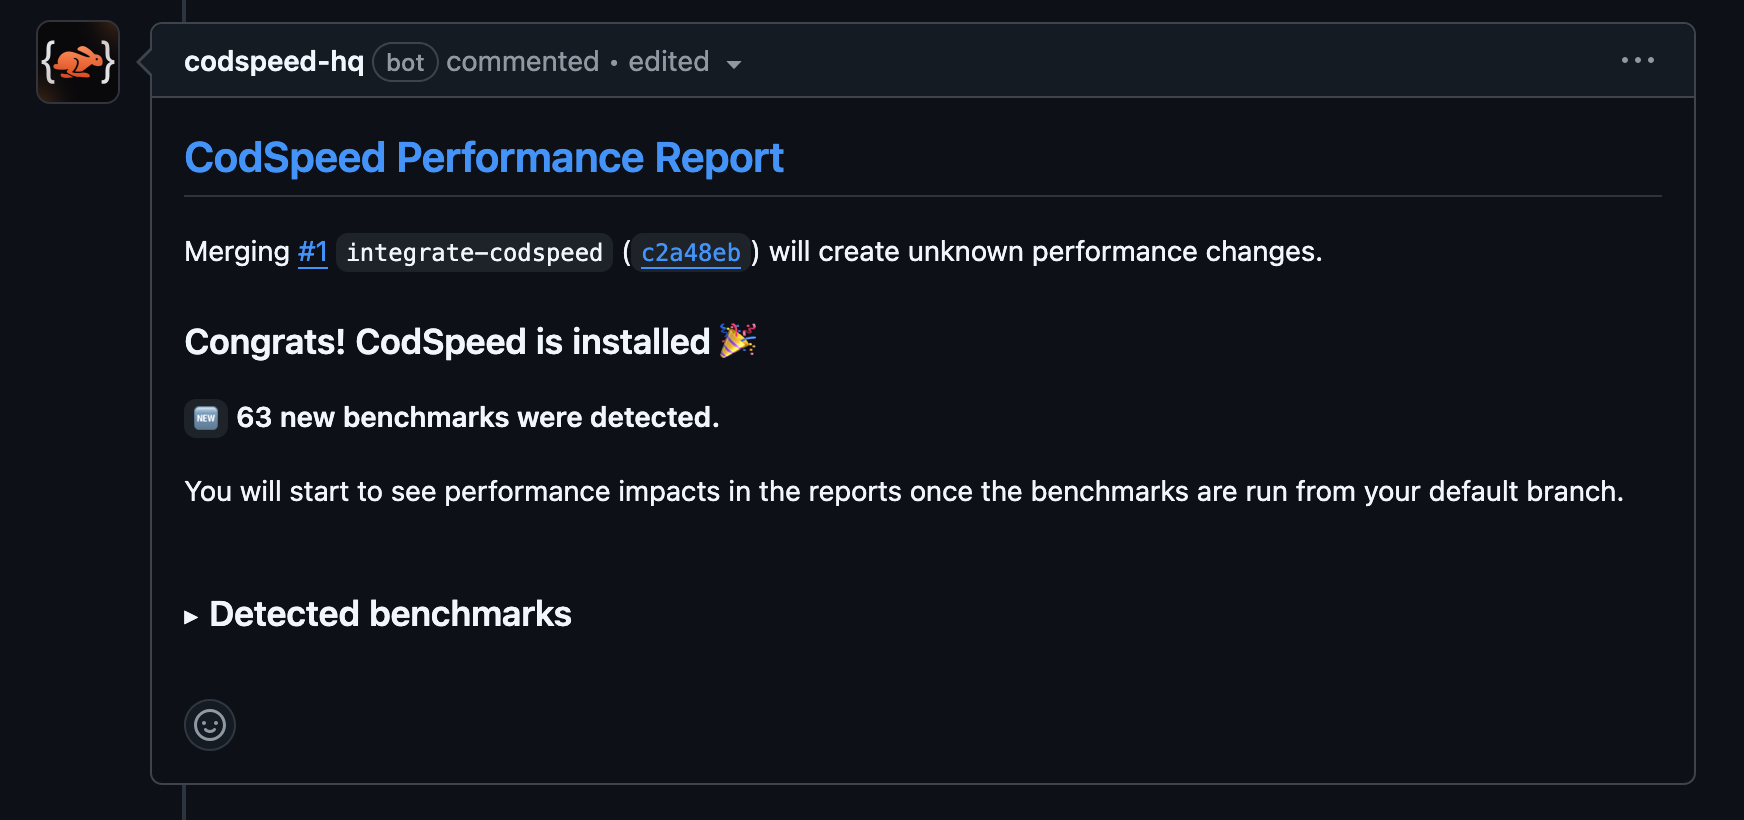
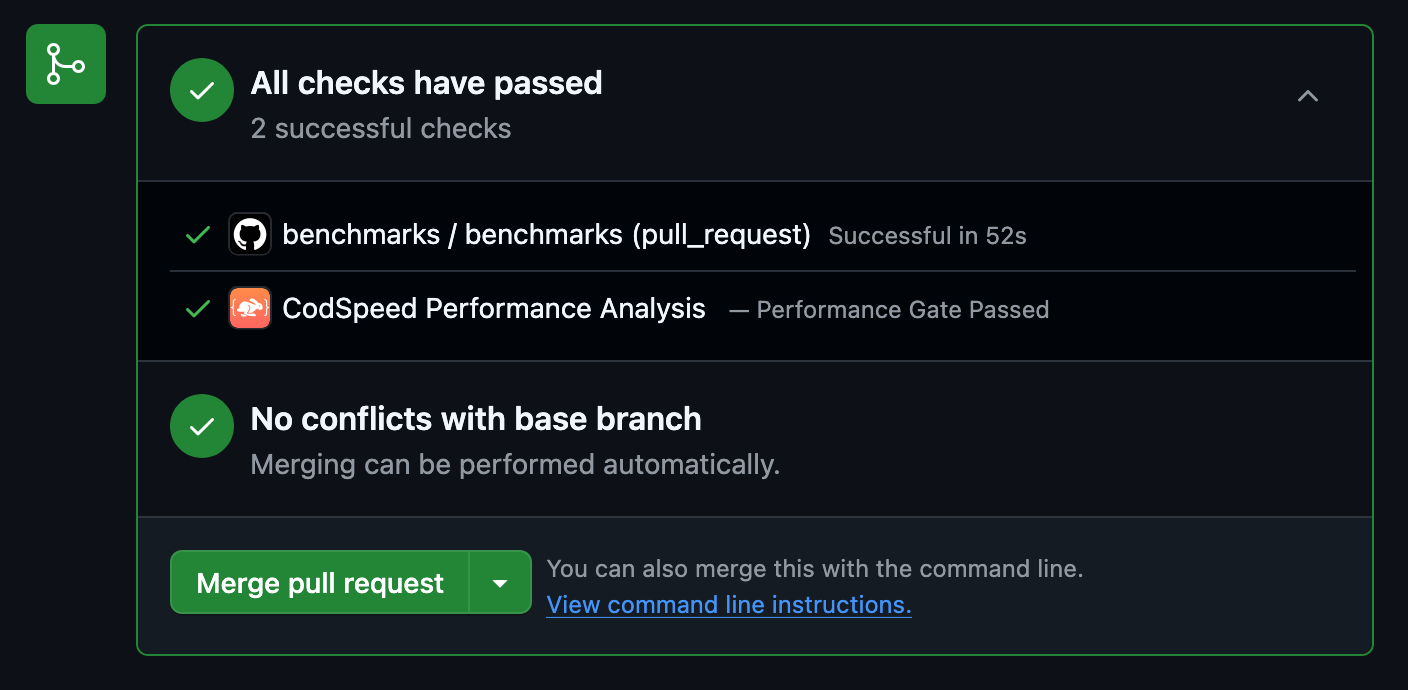
Once the workflow runs, your pull requests will receive a performance report
comment:
3
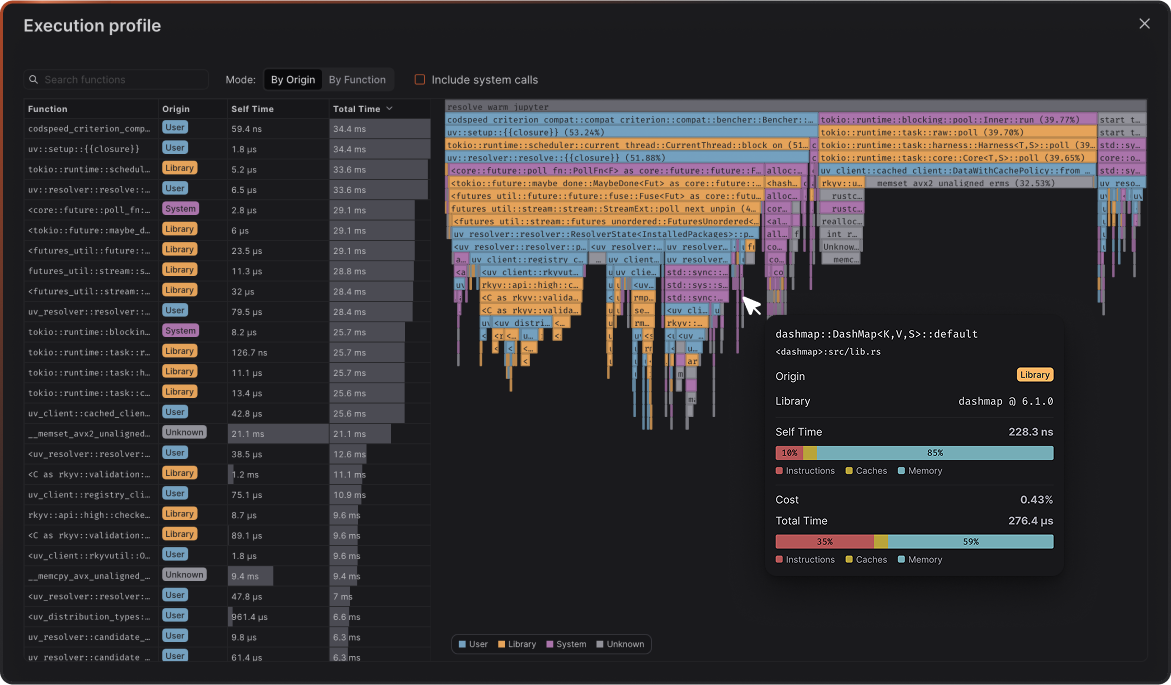
Access Detailed Reports and Flamegraphs
After your benchmarks run in CI, head over to your CodSpeed dashboard to see
detailed performance reports, historical trends, and flamegraph profiles for
deeper analysis.