Why divan?
This guide usesdivan because it
strikes the best balance between power and simplicity:
- Extensive features for both simple and complex benchmarking scenarios.
- Intuitive API that’s approachable but powerful when needed.
- Works on stable Rust without requiring nightly features.
divan also works seamlessly with parametrization, type generics, and dynamic
input generation. You can even benchmark across different types to compare their
performance characteristics.
Rust has several benchmarking frameworks to choose from:
divan,
criterion.rs, and libtest (bencher). This guide uses divan for its
simplicity and powerful features.Your First Benchmark
Let’s start by creating a simple benchmark for a recursive Fibonacci function.Installation
First, adddivan to your project’s dev dependencies:
Writing the Benchmark
Create a new file inbenches/fibonacci.rs:
benches/fibonacci.rs
divan::main()discovers and runs all benchmarks in the file.#[divan::bench]marks a function as a benchmark.divan::black_box()prevents the compiler from optimizing away our function call.
Configuration
Add the benchmark target to yourCargo.toml:
Cargo.toml
harness = false setting tells Cargo to use divan’s benchmark runner
instead of the default one.
Running the Benchmark
Now run your benchmark:terminal
fibonacci(10) is 158.5 nanoseconds.
Benchmarking with Arguments
So far, we’ve only tested our function with a single input value (10). But what if we want to see how performance changes with different input sizes? This is where theargs parameter comes in.
Let’s update our benchmark to test multiple input sizes:
benches/fibonacci.rs
cargo bench, you’ll see results for each input:
terminal
- Nanoseconds (ns): For small inputs (1-4), the function is incredibly fast.
- Microseconds (µs): At n=16, we’re in the microsecond range (1,000x slower).
- Milliseconds (ms): At n=32, we’ve reached milliseconds (1,000,000x slower than n=1).
Benchmarking only what matters
Sometimes, you want to exclude setup time from your benchmarks. For example, if you’re benchmarking a search function that operates on a large dataset, you don’t want to include the time it takes to create that dataset in every iteration. Here’s how to do that usingdivan’s Bencher:
benches/vector_search.rs
bench_local is measured. This is perfect when
you can reuse the same input data across all iterations.
Advanced Techniques
Now that you understand the basics, let’s exploredivan’s advanced features
that make it particularly powerful.
Type Generics
You can benchmark the same operation across different types to compare their performance:benches/types.rs
&str to both &str (no-op) and String
(allocation), showing the performance difference:
terminal
Vec<T> vs. Box<[T]>, HashMap vs. BTreeMap, or any
types that implement the same trait.
Dynamic Input Generation
Sometimes you need fresh input data for each benchmark iteration, for example, when benchmarking operations that consume or modify their input. You can usewith_inputs
to generate new data for each iteration without that generation time being
measured.
Let’s benchmark a JSON parsing function that needs a fresh string each time. For
this example, we’ll use serde_json,
Rust’s most popular JSON library:
benches/json_parsing.rs
with_inputs closure runs before each benchmark iteration, but its
execution time is excluded from the measurements. This ensures you’re only
measuring the parsing performance, not the data generation.
When to use this:
- Generating random or large test data.
- Loading files or fixtures.
- Creating complex data structures.
- Any expensive setup that shouldn’t affect your measurements.
with_inputs when the input needs to be fresh for each
iteration. For inputs that can be reused across iterations, create them once
before calling bencher.
Benchmarking Async Functions
To benchmark asynchronous functions, let’s use the populartokio runtime. First, add tokio to your
dev dependencies:
bench_local to
ensure only the async function execution time is measured, excluding the runtime
setup time.
benches/async.rs
terminal
block_on and the context
switching involved in async execution. Async benchmarks are planned to be
supported natively in future versions of divan.
Best Practices
Ensure code is not optimized out
The Rust compiler is incredibly smart and might optimize away your benchmark if the result isn’t used. Here’s how to prevent this:String or Vec).
Use divan::black_box on inputs to prevent the compiler from making assumptions
about known values at compile time:
Learn more about preventing compiler optimizations in the divan
black_box
documentation.Benchmark Your Crate Functions
In real-world projects, you’ll want to benchmark functions from your own crate, not functions defined directly in the benchmark file. Here’s how to set up benchmarks for a typical algorithms library with synthetic data generation. Let’s say you have a sorting library with this function insrc/lib.rs:
src/lib.rs
benches/sorting.rs would look like to
benchmark this function with synthetic data:
benches/sorting.rs
terminal
Workspace with Multiple Crates
If you’re working in a workspace with multiple crates, your setup can look like this:terminal
divan in the root
Cargo.toml and each crate’s Cargo.toml can refer to it as a workspace
member:
Cargo.toml
Cargo.toml can look like this:
Cargo.toml
Running Benchmarks Continuously with CodSpeed
So far, you’ve been running benchmarks locally. But local benchmarking has limitations:- Inconsistent hardware: Different developers get different results
- Manual process: Easy to forget to run benchmarks before merging
- No historical tracking: Hard to spot gradual performance degradation
- No PR context: Can’t see performance impact during code review
- Automated performance regression detection in PRs
- Consistent metrics with reliable measurements across all runs
- Historical tracking to see performance over time with detailed charts
- Flamegraph profiles to see exactly what changed in your code’s execution
CodSpeed works with all three Rust benchmarking frameworks:
divan,
criterion.rs, and bencher. If you’re already using criterion.rs or
bencher, check out their respective CodSpeed integration
guides.How to set up CodSpeed with divan
Here’s how to integrate CodSpeed with yourdivan benchmarks:
1
Install cargo-codspeed
First, install the
cargo-codspeed CLI tool locally to test:2
Switch to CodSpeed Compatibility Layer
CodSpeed provides a drop-in replacement for divan that adds instrumentation for
profiling. Replace your This command updates your
divan dependency with the CodSpeed compatibility
layer:Cargo.toml to use the CodSpeed compatibility layer
while keeping the name divan, so you don’t need to change any of your
benchmark code:Cargo.toml
3
Test Locally
First, build your benchmarks with the CodSpeed instrumentation harness:This compiles your benchmarks with CodSpeed’s instrumentation enabled, which
will capture detailed profiling information during execution.Then run the benchmarks to verify everything works:
terminal
terminal
Notice there are no performance measurements (no timing numbers) in the local
output. Here, we verify your benchmarks compile and execute correctly.CodSpeed only captures actual performance data when running in CI or locally
with the
codspeed CLI.
Learn more on how to use the codspeed CLI locally.
At the moment, local runs are only supported on Ubuntu and Debian.4
Set Up GitHub Actions
Create a workflow file to run benchmarks on every push and pull request:
5
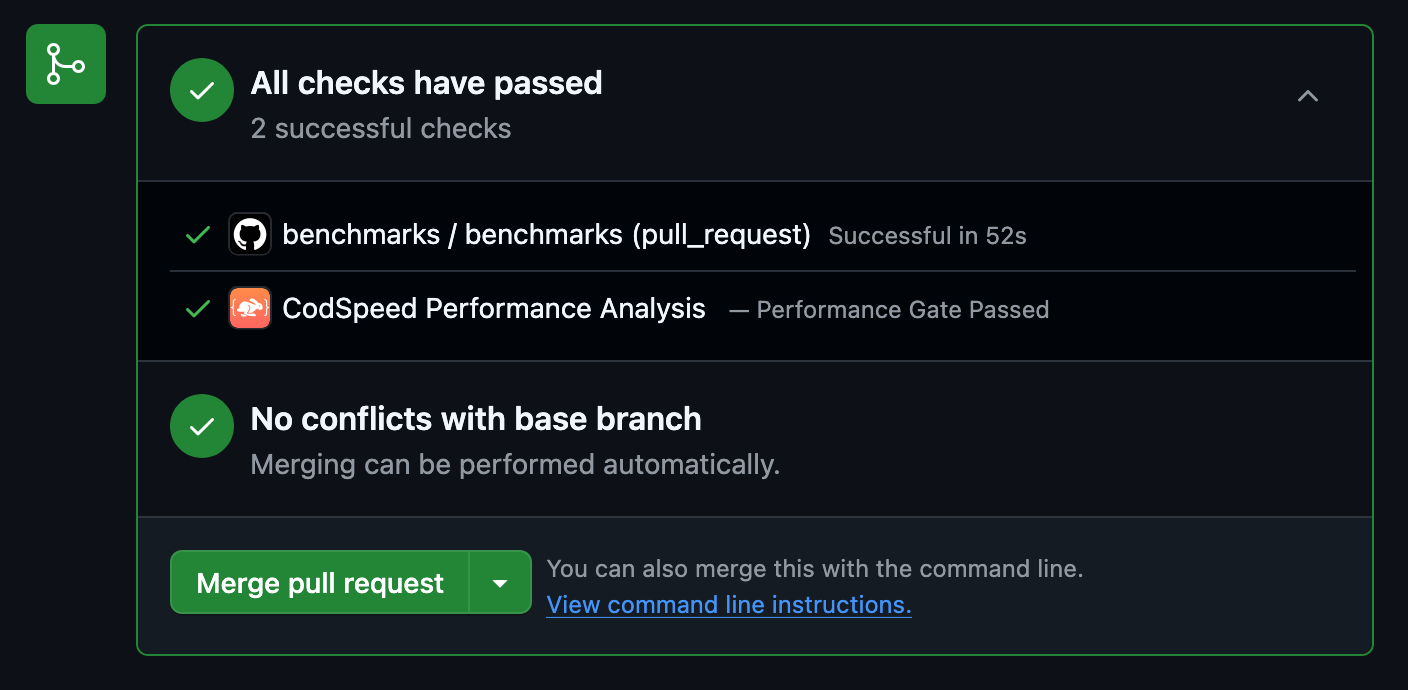
Check the Results
Once the workflow runs, your pull requests will receive a performance report
comment: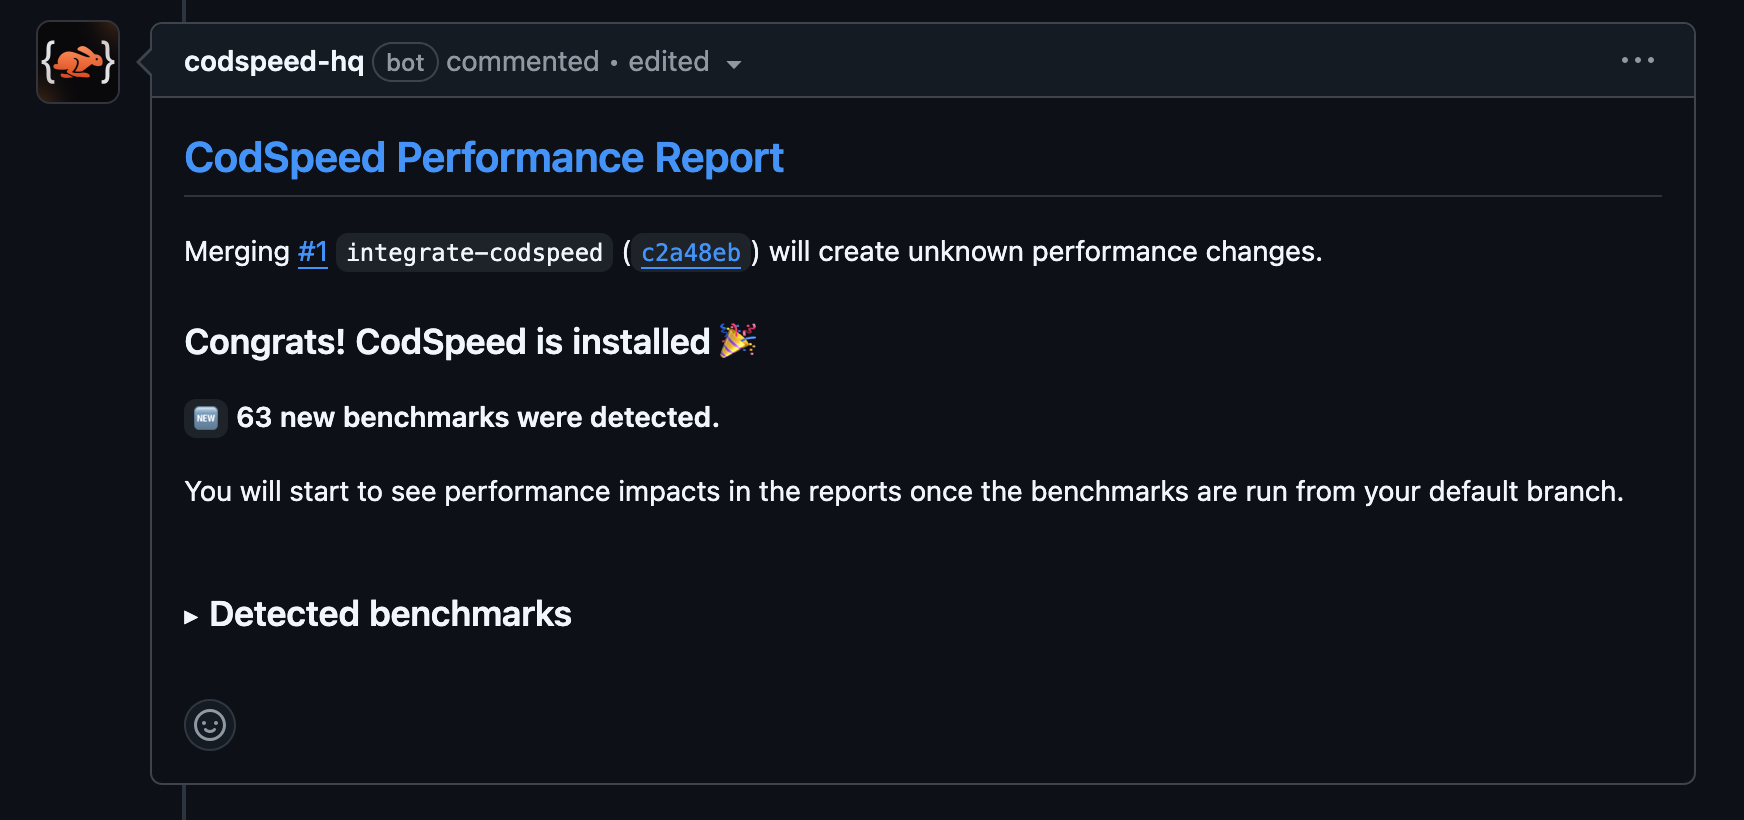
6
Access Detailed Reports and Flamegraphs
After your benchmarks run in CI, head over to your CodSpeed dashboard to see
detailed performance reports, historical trends, and flamegraph profiles for
deeper analysis.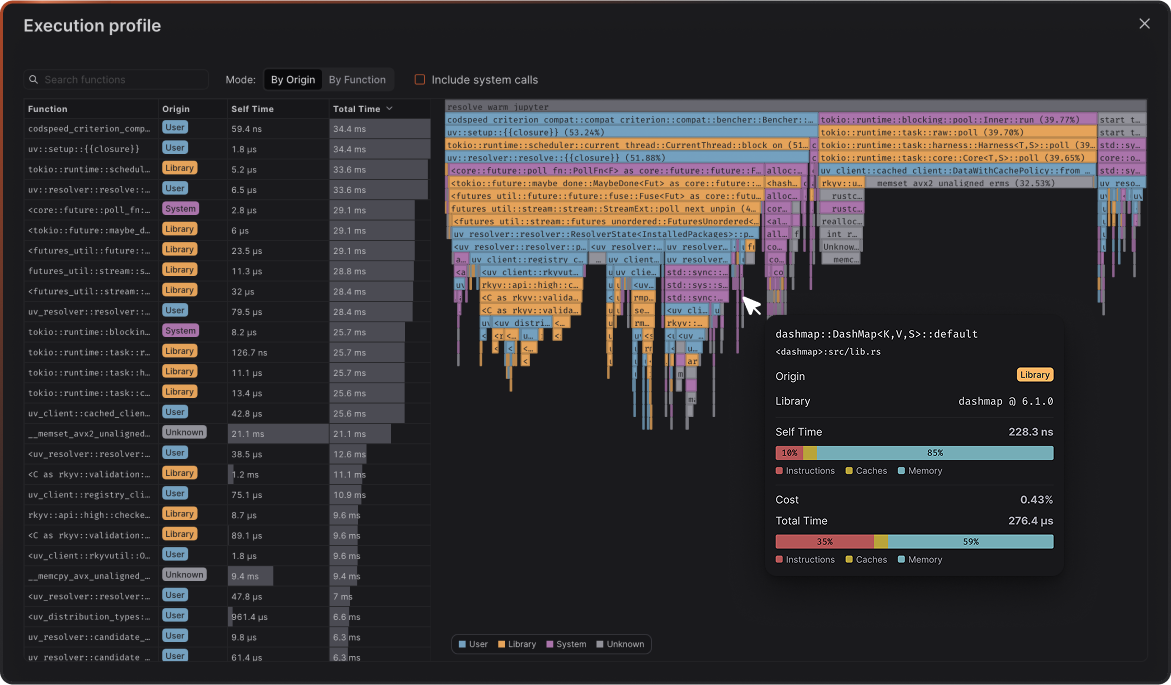
Next Steps
Check out these resources to continue your Rust benchmarking journey:Get Started with CodSpeed
Sign up and start tracking your Rust performance in CI
CodSpeed Rust Benchmarking Docs
Explore more Rust benchmarking techniques and integrations
Performance Profiling
Learn how to use flamegraphs to optimize your code
divan Documentation
Explore all of divan’s features in depth