
Choosing our Benchmarking Strategy

We are going to use google_benchmark, the standard C++ benchmarking library maintained by Google. It’s widely adopted across the C++ ecosystem, supports fixtures and parameterized benchmarks with statistical analysis, and works with CMake, Bazel, and other build systems.
This guide uses CMake as the build system. If you’re using Bazel, check out the Bazel integration documentation for build instructions.

Your First Benchmark

Let’s start by creating a benchmark for a recursive Fibonacci function to see how we can measure computational performance.

Project Setup

First, create a basic project structure:
mkdir my_project && cd my_project
mkdir benchmarks

Writing the Benchmark

Create a new file benchmarks/main.cpp:
https://mintcdn.com/codspeed/8uJag3fgHjn9hZpw/assets/icons/cpp.svg?fit=max&auto=format&n=8uJag3fgHjn9hZpw&q=85&s=ea124493b04e3ef6e5b11a53db7e75cbbenchmarks/main.cpp
#include <benchmark/benchmark.h>

// Recursive Fibonacci function to benchmark
static long long fibonacci(int n) {
  if (n <= 1)
    return n;
  return fibonacci(n - 1) + fibonacci(n - 2);
}

// Define the benchmark
static void BM_Fibonacci(benchmark::State &state) {
  // Use a volatile variable to prevent compile-time optimization
  volatile int n = 30;

  // This loop runs multiple times to get accurate measurements
  for (auto _ : state) {
    // Prevent compiler from optimizing away the computation
    auto result = fibonacci(n);
    benchmark::DoNotOptimize(result);
  }
}

// Register the benchmark, specifying the time unit as milliseconds for better
// readability
BENCHMARK(BM_Fibonacci)->Unit(benchmark::kMillisecond);

// Entrypoint that runs all registered benchmarks
BENCHMARK_MAIN();
A few things to note:
  • volatile int n = 30 prevents the compiler from computing the result at compile time
  • benchmark::State& state provides the benchmark loop that runs your code multiple times
  • for (auto _ : state) is where your actual benchmark code goes - this loop is timed
  • benchmark::DoNotOptimize() prevents the compiler from optimizing away the result
  • BENCHMARK() registers your function as a benchmark
    • ->Unit(benchmark::kMillisecond) displays results in milliseconds for better readability as by default it’s in nanoseconds
  • BENCHMARK_MAIN() provides the entry point that discovers and runs all benchmarks
To learn more about preventing compiler optimizations, check out the Prevent Compiler Optimizations section below.

Configuration with CMake

Create a CMakeLists.txt file in the benchmarks/ folder:
benchmarks/CMakeLists.txt
cmake_minimum_required(VERSION 3.14)
project(my_benchmarks VERSION 0.1.0 LANGUAGES CXX)

# Use C++17 (or your preferred version)
set(CMAKE_CXX_STANDARD 17)
set(CMAKE_CXX_STANDARD_REQUIRED ON)

# Enable optimizations with debug symbols for profiling
set(CMAKE_BUILD_TYPE RelWithDebInfo)

# Fetch google_benchmark from CodSpeed's repository
include(FetchContent)
FetchContent_Declare(
  google_benchmark
  GIT_REPOSITORY https://github.com/CodSpeedHQ/codspeed-cpp
  SOURCE_SUBDIR google_benchmark
  GIT_TAG main
)

set(BENCHMARK_DOWNLOAD_DEPENDENCIES ON)
FetchContent_MakeAvailable(google_benchmark)

# Create the benchmark executable
add_executable(bench main.cpp)

# Link against google_benchmark
target_link_libraries(bench benchmark::benchmark)
Key configuration points:
  • CMAKE_BUILD_TYPE RelWithDebInfo enables optimizations with debug symbols for accurate profiling
  • We use CodSpeed’s fork of google_benchmark which adds performance measurement capabilities and CI integration
  • BENCHMARK_DOWNLOAD_DEPENDENCIES ON allows google_benchmark to download its dependencies

Building and Running the Benchmark

Build your benchmark:
cd benchmarks
mkdir build && cd build
cmake ..
make
You should see output like:
-- The CXX compiler identification is GNU 14.2.1
-- Detecting CXX compiler ABI info
-- Detecting CXX compiler ABI info - done
-- Configuring done (8.6s)
-- Generating done (0.1s)
-- Build files have been written to: /home/user/my_project/benchmarks/build
[  1%] Building CXX object ...
...
[100%] Built target bench
Now run your benchmark:
./bench
You should see output like this:
2025-12-01T17:24:27+01:00
Running ./bench
Run on (8 X 24 MHz CPU s)
CPU Caches:
  L1 Data 64 KiB
  L1 Instruction 128 KiB
  L2 Unified 4096 KiB (x8)
Load Average: 8.47, 7.96, 7.04
-------------------------------------------------------
Benchmark             Time             CPU   Iterations
-------------------------------------------------------
BM_Fibonacci       2.74 ms         2.65 ms          271
Congratulations! You’ve created your first C++ benchmark. The output shows that computing fibonacci(30) takes about 2.74 milliseconds on average.
Understanding the results:
  • Time: Wall-clock time per iteration (lower is better)
  • CPU: CPU time per iteration (accounts for multi-threading)
  • Iterations: How many times the benchmark ran to get reliable measurements

Benchmarking with Parameters

So far, we’ve only tested our function with a single input (n=30). But what if we want to see how performance changes with different input sizes? This is where DenseRange comes in. Let’s add a parameterized benchmark to test Fibonacci with various input sizes. Update your main.cpp to include:
https://mintcdn.com/codspeed/8uJag3fgHjn9hZpw/assets/icons/cpp.svg?fit=max&auto=format&n=8uJag3fgHjn9hZpw&q=85&s=ea124493b04e3ef6e5b11a53db7e75cbbenchmarks/main.cpp
// Define the benchmark with a parameter
static void BM_Fibonacci_DenseRange(benchmark::State &state) {
  // Get the input value from the benchmark parameter
  volatile int n = state.range(0);

  for (auto _ : state) {
    auto result = fibonacci(n);
    benchmark::DoNotOptimize(result);
  }
}

// Test Fibonacci with inputs from 15 to 35 in steps of 5
BENCHMARK(BM_Fibonacci_DenseRange)
    ->DenseRange(15, 35, 5) // Test inputs 15, 20, 25, 30, 35
    ->Unit(benchmark::kMillisecond);
Now state.range(0) gives us the input parameter, and DenseRange(15, 35, 5) tells the benchmark to run with inputs 15, 20, 25, 30, and 35. Rebuild and run:
make
./bench --benchmark_filter=Fibonacci_DenseRange
We used the --benchmark_filter flag to only run benchmarks matching Fibonacci_DenseRange. This is useful when you have many benchmarks and want to focus on a subset.Learn more about benchmark a subset of benchmarks.
You should see output like:
---------------------------------------------------------------------
Benchmark                           Time             CPU   Iterations
---------------------------------------------------------------------
BM_Fibonacci_DenseRange/15      0.002 ms        0.002 ms       380948
BM_Fibonacci_DenseRange/20      0.022 ms        0.021 ms        33413
BM_Fibonacci_DenseRange/25      0.276 ms        0.234 ms         3050
BM_Fibonacci_DenseRange/30       2.62 ms         2.59 ms          278
BM_Fibonacci_DenseRange/35       28.1 ms         28.0 ms           25
Notice how the execution time grows exponentially with the input size, clearly demonstrating the O(2^n) complexity of the recursive Fibonacci algorithm. This is the power of parameterized benchmarks – they help you understand how your code scales with different inputs.

Multiple Arguments

What if your function takes multiple parameters? For example, let’s benchmark the performance of std::string::find() with varying text and pattern sizes. Let’s add a new benchmark to main.cpp:
https://mintcdn.com/codspeed/8uJag3fgHjn9hZpw/assets/icons/cpp.svg?fit=max&auto=format&n=8uJag3fgHjn9hZpw&q=85&s=ea124493b04e3ef6e5b11a53db7e75cbbenchmarks/main.cpp
// ... (previous code) ...
#include <string>

static void BM_StringFind(benchmark::State& state) {
  size_t string_size = state.range(0);
  size_t pattern_size = state.range(1);

  // Setup
  std::string text(string_size, 'a');
  std::string pattern(pattern_size, 'b');
  // Place pattern near the end for worst-case scenario
  text.replace(string_size - pattern_size, pattern_size, pattern);

  // Benchmark
  for (auto _ : state) {
    auto pos = text.find(pattern);
    benchmark::DoNotOptimize(pos);
  }
}

// Benchmark different combinations of text and pattern sizes using ArgsProduct
BENCHMARK(BM_StringFind)
    ->ArgsProduct({
        {1000, 10000, 100000}, // Text sizes
        {50, 500}              // Pattern sizes
    });
The ArgsProduct() function creates benchmarks for all combinations of the provided argument lists. In this case, it generates 6 benchmarks (3 text sizes × 2 pattern sizes), letting you analyze how both parameters affect performance. Here is the output when you run this benchmark:
./bench --benchmark_filter=StringFind
...
-------------------------------------------------------------------
Benchmark                         Time             CPU   Iterations
-------------------------------------------------------------------
BM_StringFind/1000/50          28.7 ns         28.0 ns     25077651
BM_StringFind/10000/50          337 ns          237 ns      3123341
BM_StringFind/100000/50        2157 ns         2066 ns       287731
BM_StringFind/1000/500         30.3 ns         28.6 ns     24820407
BM_StringFind/10000/500         248 ns          243 ns      2987100
BM_StringFind/100000/500       2075 ns         2031 ns       348384
There are more ways to define parameterized benchmarks, check out the google_benchmark documentation on parameterized benchmarks.

Benchmarking Only What Matters

Sometimes you have expensive setup that shouldn’t be included in your benchmark measurements. For example, loading data from a file or creating large data structures. Google Benchmark provides several ways to handle this.

Fresh Setup per Iteration

Let’s benchmark a sorting algorithm where we need fresh data for each iteration. We do not want the data generation time to be included in the benchmark. We can exclude it using PauseTiming() and ResumeTiming():
https://mintcdn.com/codspeed/8uJag3fgHjn9hZpw/assets/icons/cpp.svg?fit=max&auto=format&n=8uJag3fgHjn9hZpw&q=85&s=ea124493b04e3ef6e5b11a53db7e75cbbenchmarks/main.cpp
// ... (previous code) ...
#include <algorithm>
#include <random>
#include <vector>

static void BM_SortVector(benchmark::State &state) {
  size_t size = state.range(0);
  std::mt19937 gen(42); // Fixed seed for reproducibility

  for (auto _ : state) {
    // Pause timing during setup
    state.PauseTiming();

    // Generate random data (NOT measured)
    std::vector<int> data(size);
    std::uniform_int_distribution<> dis(1, 10000);
    for (size_t i = 0; i < size; ++i) {
      data[i] = dis(gen);
    }

    // Resume timing for the actual work
    state.ResumeTiming();

    // Sort the vector (MEASURED)
    std::sort(data.begin(), data.end());
    benchmark::DoNotOptimize(data.data());
    benchmark::ClobberMemory();
  }
}

BENCHMARK(BM_SortVector)->Range(100, 100000)->Unit(benchmark::kMicrosecond);
The setup code (generating random data) runs before each iteration but isn’t included in the timing. Only the std::sort() call is measured.
Use PauseTiming/ResumeTiming sparinglyWhile PauseTiming() and ResumeTiming() are useful, they add overhead to your benchmarks. If your setup can be done once before all iterations (like loading a file), use fixtures instead (see next section) for better performance and cleaner code.

Shared Setup for All Iterations

When you can reuse the same data across iterations, fixtures are more efficient. They are a class that defines a setup and teardown process that runs once for all iterations. Both of these methods are not included in the timing. Here is an example where we set up a sorted vector once for all iterations and benchmark binary search on it:
https://mintcdn.com/codspeed/8uJag3fgHjn9hZpw/assets/icons/cpp.svg?fit=max&auto=format&n=8uJag3fgHjn9hZpw&q=85&s=ea124493b04e3ef6e5b11a53db7e75cbbenchmarks/main.cpp
// Define a fixture class that sets up a random vector for searching
class VectorFixture : public benchmark::Fixture {
public:
  std::vector<int> data;

  // Setup runs once before all iterations
  void SetUp(const ::benchmark::State &state) {
    size_t size = state.range(0);
    std::mt19937 gen(42); // Fixed seed for reproducibility
    std::uniform_int_distribution<> dis(1, size);
    data.resize(size);
    for (size_t i = 0; i < size; ++i) {
      data[i] = dis(gen);
    }
    std::sort(data.begin(), data.end());
  }

  // TearDown runs once after all iterations
  void TearDown(const ::benchmark::State &) { data.clear(); }
};

// Define the BinarySearch benchmark using VectorFixture
BENCHMARK_DEFINE_F(VectorFixture, BinarySearch)(benchmark::State &state) {
  int target = data.size() / 2;

  for (auto _ : state) {
    // Only this is measured
    bool found = std::binary_search(data.begin(), data.end(), target);
    benchmark::DoNotOptimize(found);
  }
}

// Register the fixture benchmark with different vector sizes
BENCHMARK_REGISTER_F(VectorFixture, BinarySearch)->Range(1000, 100000);
In this example, the SetUp() method initializes a sorted vector once before all iterations, and TearDown() cleans up afterward. The benchmark only measures the std::binary_search() calls. Fixtures use different macros: BENCHMARK_DEFINE_F to define and BENCHMARK_REGISTER_F to register with parameters.

Best Practices

Prevent Compiler Optimizations

The C++ compiler is extremely aggressive with optimizations. Always protect your benchmarks:
https://mintcdn.com/codspeed/8uJag3fgHjn9hZpw/assets/icons/cpp.svg?fit=max&auto=format&n=8uJag3fgHjn9hZpw&q=85&s=ea124493b04e3ef6e5b11a53db7e75cb
// ❌ BAD: Compiler might optimize everything away
static void BM_Bad(benchmark::State& state) {
  for (auto _ : state) {
    int x = 42;
    int y = x * 2; // Compiler knows this is 84 at compile time
  }
}

// ✅ GOOD: Use DoNotOptimize for values
static void BM_Good(benchmark::State& state) {
  for (auto _ : state) {
    int x = 42;
    benchmark::DoNotOptimize(x);
    int y = x * 2;
    benchmark::DoNotOptimize(y);
  }
}

// ✅ BETTER: Use DoNotOptimize and ClobberMemory
static void BM_Better(benchmark::State& state) {
  for (auto _ : state) {
    int x = 42;
    benchmark::DoNotOptimize(x);
    int y = x * 2;
    benchmark::DoNotOptimize(y);
    benchmark::ClobberMemory();
  }
}
Important: Always use benchmark::DoNotOptimize() to prevent the compiler from optimizing away your benchmarks. Without it, the compiler might eliminate the code you’re trying to measure, giving you inaccurate results.Understanding DoNotOptimize vs ClobberMemory:
  • DoNotOptimize(value) forces the result of a computation to be stored in memory or a register, preventing the compiler from eliminating the computation entirely
  • ClobberMemory() forces the compiler to flush all pending writes to memory, preventing operations with memory side effects from being optimized away
  • Use DoNotOptimize() for return values and computed results
  • Add ClobberMemory() when benchmarking operations that modify memory (like filling vectors or copying data)
Learn more in the Google Benchmark guide on preventing optimization.

Keep Benchmarks Deterministic

Use fixed seeds for random number generators:
https://mintcdn.com/codspeed/8uJag3fgHjn9hZpw/assets/icons/cpp.svg?fit=max&auto=format&n=8uJag3fgHjn9hZpw&q=85&s=ea124493b04e3ef6e5b11a53db7e75cb
// ❌ BAD: Non-deterministic results
static void BM_NonDeterministic(benchmark::State& state) {
  std::random_device rd;
  std::mt19937 gen(rd()); // Different every run!

  for (auto _ : state) {
    // ...
  }
}

// ✅ GOOD: Deterministic with fixed seed
static void BM_Deterministic(benchmark::State& state) {
  std::mt19937 gen(42); // Fixed seed

  for (auto _ : state) {
    // ...
  }
}

Benchmark Real-World Code

In real projects, you’ll benchmark functions from your library. Here’s a typical structure for a C++ project with benchmarks:
my_project/
├── CMakeLists.txt
├── include/
│   └── mylib/
│       └── algorithms.hpp
├── src/
│   └── algorithms.cpp
└── benchmarks/
    └── bench_algorithms.cpp
The header include/mylib/algorithms.hpp defines your library’s API:
https://mintcdn.com/codspeed/8uJag3fgHjn9hZpw/assets/icons/cpp.svg?fit=max&auto=format&n=8uJag3fgHjn9hZpw&q=85&s=ea124493b04e3ef6e5b11a53db7e75cbinclude/mylib/algorithms.hpp
#pragma once
#include <vector>

namespace mylib {

std::vector<int> bubble_sort(std::vector<int> arr);

} // namespace mylib
The implementation src/algorithms.cpp contains the actual algorithm:
https://mintcdn.com/codspeed/8uJag3fgHjn9hZpw/assets/icons/cpp.svg?fit=max&auto=format&n=8uJag3fgHjn9hZpw&q=85&s=ea124493b04e3ef6e5b11a53db7e75cbsrc/algorithms.cpp
#include "mylib/algorithms.hpp"

namespace mylib {

std::vector<int> bubble_sort(std::vector<int> arr) {
  size_t n = arr.size();
  for (size_t i = 0; i < n; ++i) {
    for (size_t j = 0; j < n - 1 - i; ++j) {
      if (arr[j] > arr[j + 1]) {
        std::swap(arr[j], arr[j + 1]);
      }
    }
  }
  return arr;
}

} // namespace mylib
The benchmark benchmarks/bench_algorithms.cpp tests the bubble sort function:
https://mintcdn.com/codspeed/8uJag3fgHjn9hZpw/assets/icons/cpp.svg?fit=max&auto=format&n=8uJag3fgHjn9hZpw&q=85&s=ea124493b04e3ef6e5b11a53db7e75cbbenchmarks/bench_algorithms.cpp
#include "mylib/algorithms.hpp"
#include <benchmark/benchmark.h>
#include <random>

// Define a fixture class that sets up random data for sorting
class SortFixture : public benchmark::Fixture {
public:
  std::vector<int> original_data;

  // Setup runs once before all iterations
  void SetUp(const ::benchmark::State &state) {
    size_t size = state.range(0);
    std::mt19937 gen(42); // Fixed seed for reproducibility
    std::uniform_int_distribution<> dis(1, size);
    original_data.resize(size);
    for (size_t i = 0; i < size; ++i) {
      original_data[i] = dis(gen);
    }
  }

  // TearDown runs once after all iterations
  void TearDown(const ::benchmark::State &) { original_data.clear(); }
};

// Define the BubbleSort benchmark using SortFixture
BENCHMARK_DEFINE_F(SortFixture, BubbleSort)(benchmark::State &state) {
  for (auto _ : state) {
    // Make a copy of the original data for each iteration
    // Only the sorting is measured, not the copy
    state.PauseTiming();
    std::vector<int> data = original_data;
    state.ResumeTiming();

    auto sorted = mylib::bubble_sort(data);
    benchmark::DoNotOptimize(sorted.data());
    benchmark::ClobberMemory();
  }
}

// Register the fixture benchmark with different data sizes
BENCHMARK_REGISTER_F(SortFixture, BubbleSort)
    ->Range(1000, 100000)
    ->Unit(benchmark::kMillisecond);

BENCHMARK_MAIN();
Update your CMakeLists.txt to build both your library and benchmarks:
CMakeLists.txt
cmake_minimum_required(VERSION 3.14)
project(mylib VERSION 0.1.0 LANGUAGES CXX)

set(CMAKE_CXX_STANDARD 17)
set(CMAKE_CXX_STANDARD_REQUIRED ON)

# Enable optimizations with debug symbols for profiling
set(CMAKE_BUILD_TYPE RelWithDebInfo)

# Your library
add_library(mylib src/algorithms.cpp)
target_include_directories(mylib PUBLIC include)

# Fetch google_benchmark
include(FetchContent)
FetchContent_Declare(
  google_benchmark
  GIT_REPOSITORY https://github.com/CodSpeedHQ/codspeed-cpp
  SOURCE_SUBDIR google_benchmark
  GIT_TAG main
)

set(BENCHMARK_DOWNLOAD_DEPENDENCIES ON)
FetchContent_MakeAvailable(google_benchmark)

# Benchmark executable
add_executable(bench_algorithms benchmarks/bench_algorithms.cpp)
target_link_libraries(bench_algorithms mylib benchmark::benchmark)
You can now build and run your benchmarks with the following commands:
mkdir build && cd build
cmake ..
make
./bench_algorithms
This will yield an output similar to:
2025-12-02T16:50:44+01:00
Running ./bench_algorithms
Run on (8 X 24 MHz CPU s)
CPU Caches:
  L1 Data 64 KiB
  L1 Instruction 128 KiB
  L2 Unified 4096 KiB (x8)
Load Average: 9.83, 10.83, 8.99
------------------------------------------------------------------------
Benchmark                              Time             CPU   Iterations
------------------------------------------------------------------------
SortFixture/BubbleSort/1000        0.381 ms        0.321 ms         2219
SortFixture/BubbleSort/4096         5.80 ms         4.97 ms          136
SortFixture/BubbleSort/32768         732 ms          718 ms            1
SortFixture/BubbleSort/100000      10848 ms         9529 ms            1

Running Benchmarks Continuously with CodSpeed

So far, you’ve been running benchmarks locally. But local benchmarking has limitations:
  • Inconsistent hardware: Different developers get different results
  • Manual process: Easy to forget to run benchmarks before merging
  • No historical tracking: Hard to spot gradual performance degradation
  • No PR context: Can’t see performance impact during code review
This is where CodSpeed comes in. It runs your benchmarks automatically in CI and provides:
  • Automated performance regression detection in PRs
  • Consistent metrics with reliable measurements across all runs
  • Historical tracking to see performance over time with detailed charts
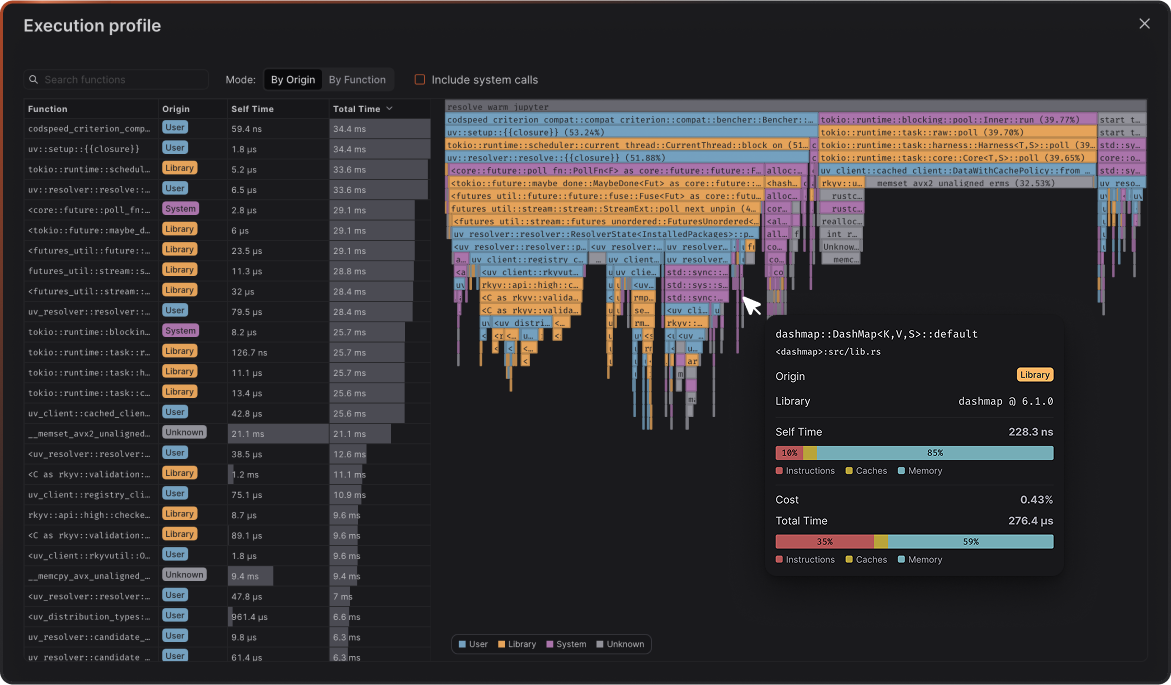
  • Flamegraph profiles to see exactly what changed in your code’s execution

How to set up CodSpeed with google_benchmark

Here’s how to integrate CodSpeed with your google_benchmark benchmarks using CMake:
1

Build and run the benchmarks locally with CodSpeed enabled

CodSpeed provides a special build mode that instruments your benchmarks for performance tracking.This is controlled with the CODSPEED_MODE CMake flag, which can be set to:
  • off: (default) Regular benchmarking without CodSpeed
  • simulation: CodSpeed CPU simulation mode for CI
  • walltime: Walltime measurements (see walltime docs)
Build your benchmarks with CodSpeed mode enabled:
cd benchmarks
mkdir build && cd build
cmake -DCODSPEED_MODE=simulation ..
make
Run the benchmarks to verify everything works:
./bench_algorithms
You should see output indicating CodSpeed is enabled:
Codspeed mode: simulation
2025-12-02T17:21:57+01:00
Running ./bench_algorithms
Run on (8 X 24 MHz CPU s)
CPU Caches:
  L1 Data 64 KiB
  L1 Instruction 128 KiB
  L2 Unified 4096 KiB (x8)
Load Average: 9.22, 7.26, 6.71
NOTICE: codspeed is enabled, but no performance measurement will be made since it's running in an unknown environment.
Checked: cpp/benchmarks/bench_algorithms.cpp::BubbleSort[SortFixture][1000]
Checked: cpp/benchmarks/bench_algorithms.cpp::BubbleSort[SortFixture][4096]
Checked: cpp/benchmarks/bench_algorithms.cpp::BubbleSort[SortFixture][32768]
Checked: cpp/benchmarks/bench_algorithms.cpp::BubbleSort[SortFixture][100000]
Notice there are no timing measurements in the local output. CodSpeed only captures actual performance data when running in CI.
2

Set Up GitHub Actions

Create a workflow file to run benchmarks on every push and pull request:
.github/workflows/codspeed.yml
name: CodSpeed Benchmarks

on:
  push:
    branches:
      - "main" # or "master"
  pull_request:
  # `workflow_dispatch` allows CodSpeed to trigger backtest
  # performance analysis in order to generate initial data.
  workflow_dispatch:

permissions: # optional for public repositories
  contents: read # required for actions/checkout
  id-token: write # required for OIDC authentication with CodSpeed
  
jobs:
  benchmarks:
    name: Run benchmarks
    runs-on: ubuntu-latest
    steps:
      - uses: actions/checkout@v5
      # ...
      # Setup your environment here:
      #  - Configure your Python/Rust/Node version
      #  - Install your dependencies
      #  - Build your benchmarks (if using a compiled language)
      # ...
      - name: Run the benchmarks
        uses: CodSpeedHQ/action@v4
        with:
          mode: simulation
          run: <Insert your benchmark command here>
3

Check the Results

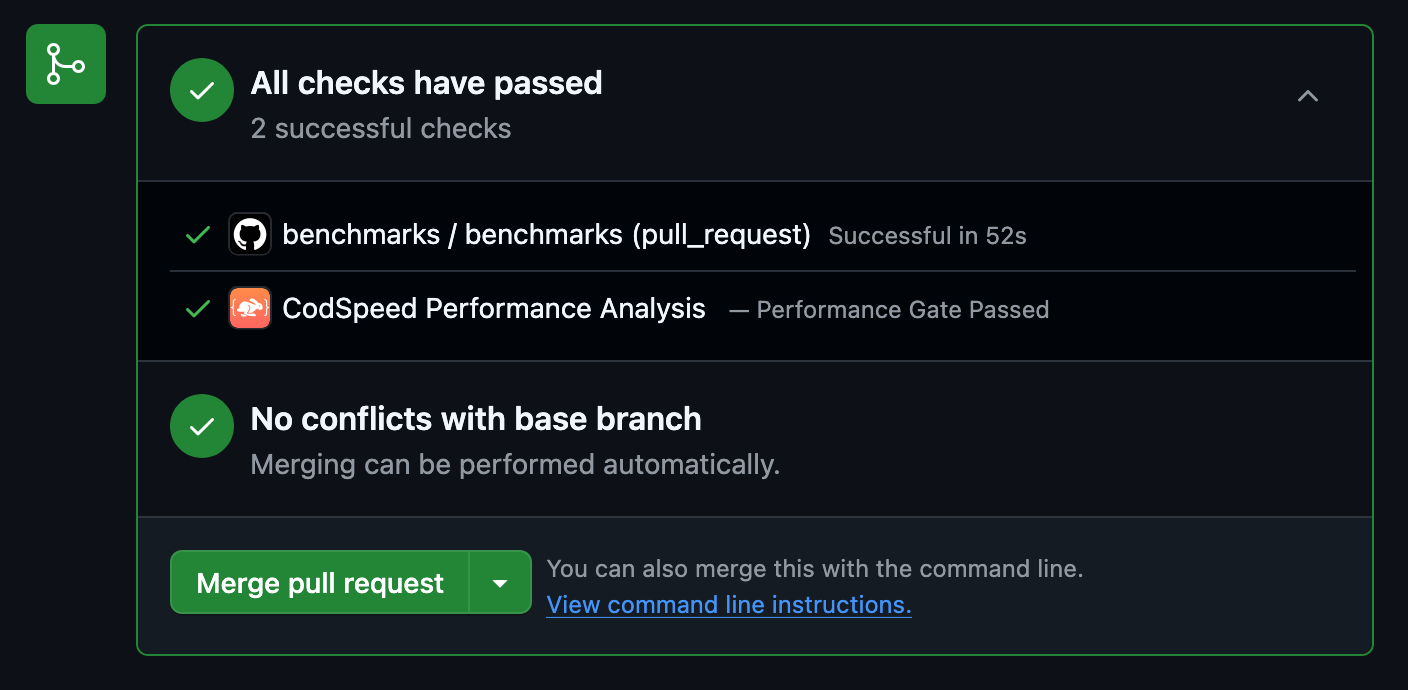
Once the workflow runs, your pull requests will receive a performance report comment:Pull Request ResultPull Request Result
4

Access Detailed Reports and Flamegraphs

After your benchmarks run in CI, head over to your CodSpeed dashboard to see detailed performance reports, historical trends, and flamegraph profiles for deeper analysis.
Profiling Report on CodSpeed

Profiling Report on CodSpeed

Profiling works out of the box, no extra configuration needed!Learn more about flamegraphs and how to use them to optimize your code.
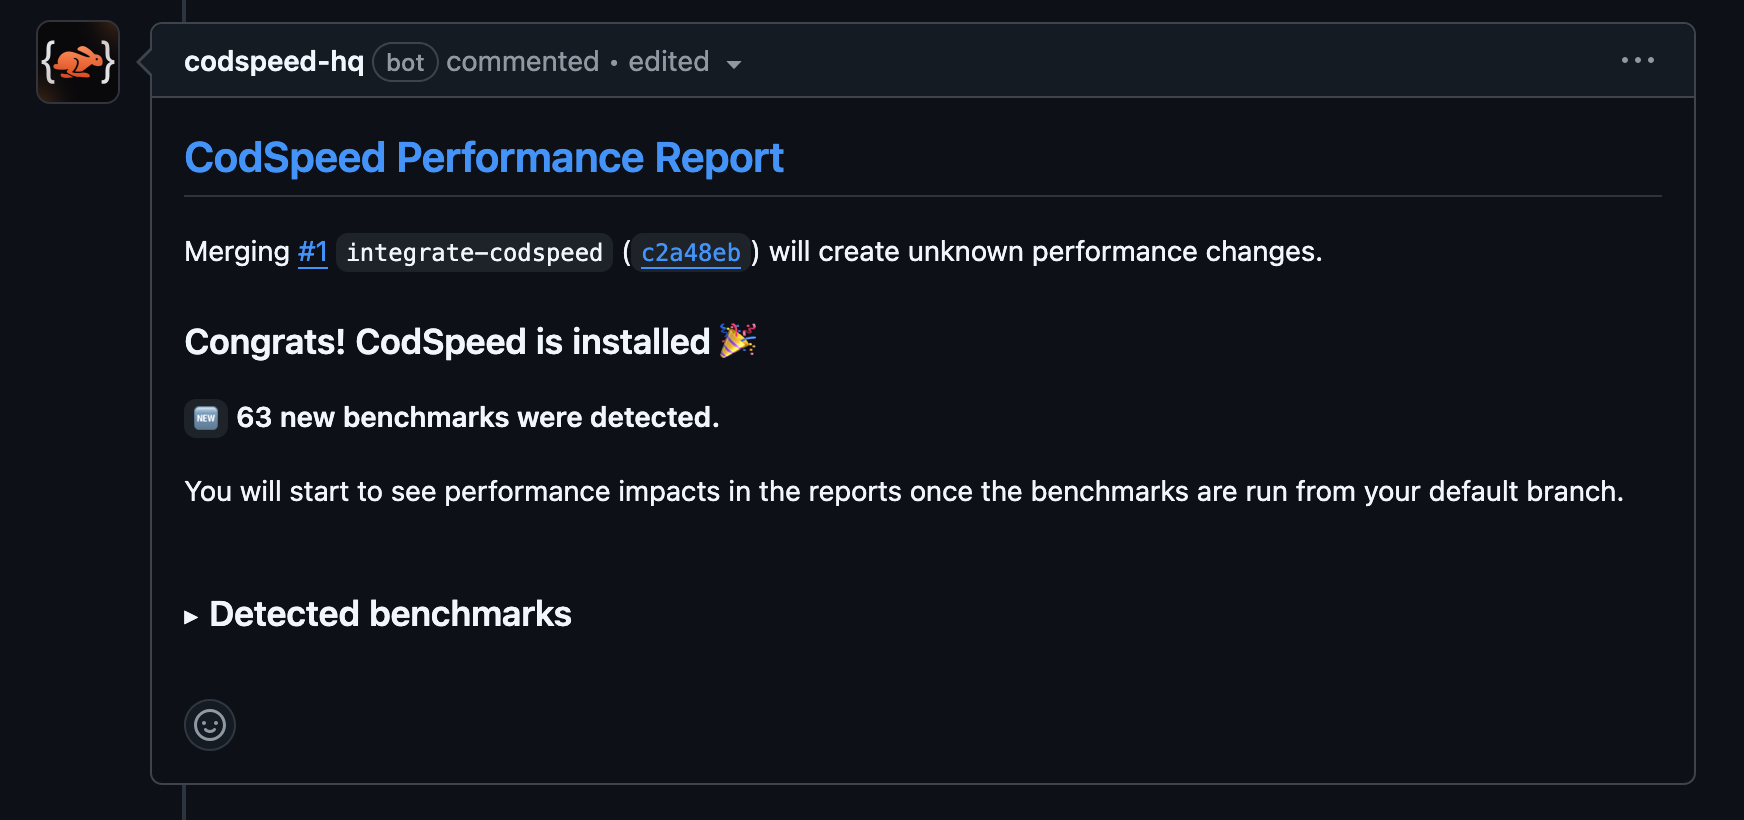
Using Bazel?If you’re using Bazel as your build system, check out the Bazel integration documentation for detailed setup instructions with CodSpeed.

Next Steps

Check out these resources to continue your C++ benchmarking journey: