Pinpoint performance regressions with CI-Integrated differential profiling
Flame Graphs are a visualization tool that helps you understand how your software is performing. They display the call stack of a program and the time spent in each function. They are a powerful tool to quickly identify performance bottlenecks.
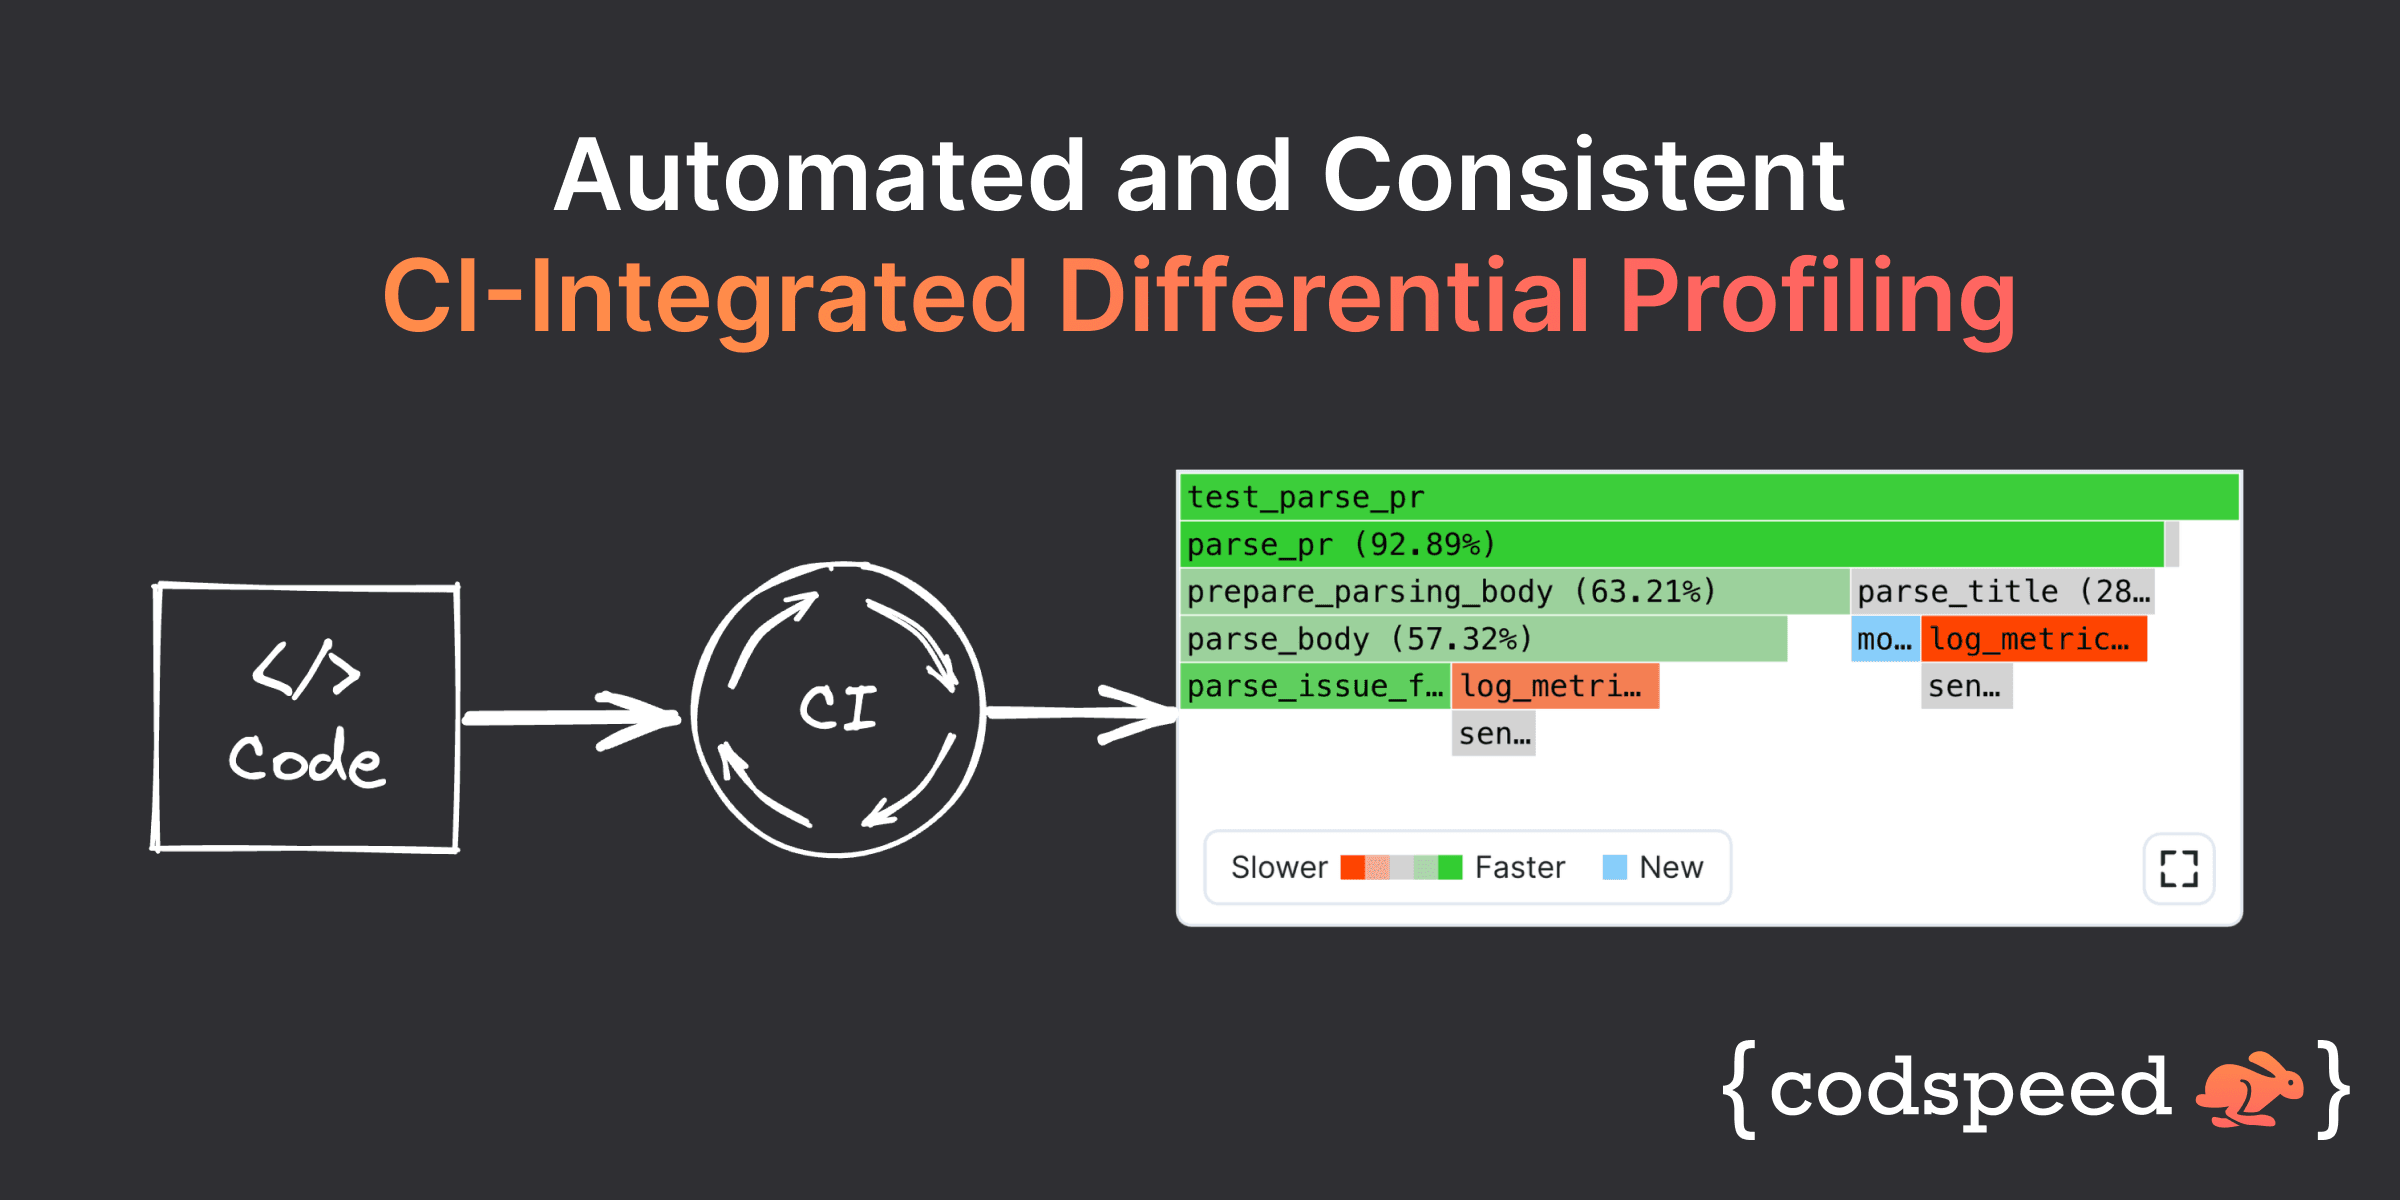
Differential Flame Graphs combine two flame graphs to highlight the differences between them. They allow you to easily spot performance regressions and improvements and gain invaluable insights into your software's performance.
Below you can find an example of normal and differential flame graphs following
a change in a codebase. At a glance, we can understand where the code has become
slower. Here it is the parse_issue_fixed function as it has the brightest red
color.
Flame Graphs component taken from the CodSpeed app. It is fully interactive, don't hesitate to play with the buttons!
Let's explore how to read flame graphs and how CodSpeed automates flame graph generation in your CI pipeline.
CodSpeed supports Rust, Node.js, Python and generates flame graphs out of the box. More languages are coming soon!
Spotting a performance regression
Let's dive into the previous example.
We have a function parse_issue_fixed that parses a GitHub pull request body
and extracts the issue number that it fixes. Given body = "fixes #123", the
function returns 123. Here body can be a multiline string, and the issue
number can be anywhere in the string.
On GitHub, adding the string fixes #123 in a pull request body will automatically close the
issue #123 when the pull request is merged.
We notice that the code is quite long and not easily understandable. We refactor it to use a regular expression instead. This gives us the following diff:
import re
FIXES_REGEX = re.compile(r"fixes #(\d+)")
def parse_issue_fixed(body: str) -> int | None:
prefix = "fixes #"
index = body.find(prefix)
if index == -1:
return None
end = start
while end < len(body) and body[end].isdigit():
end += 1
return int(body[start:end])
match = FIXES_REGEX.search(body)
return int(match.group(1)) if match else NoneGreat, we have a much shorter and more readable function. But did we introduce a performance regression?
We already have a benchmark in place for the function parse_pr, a higher-level
function that parses a GitHub pull request body and calls multiple functions to
retrieve information, including parse_issue_fixed. The input is a multiline
string of approximately 50kB. We chose a large input to better understand the
performance characteristics of the function and make sure the function performs
well when parsing large pull request bodies.
Let's check out the flame graphs for the benchmark to analyze the performance impact of our change. The Base flame graph is the one before the change, the Head flame graph is the one after the change, and finally, the Diff flame graph is the difference between the two.
Here we can see that the parse_issue_fixed function is bright red, thus
denoting that it was slower after the change and had the biggest performance
impact on the benchmark. When hovering over the parse_issue_fixed frame, we
can see that the performance impact is a -21.5% regression on the overall
benchmark.
So in our use case, using a regular expression will result in slower executions
compared to using str.find.
So yes, our change for the sake of readability introduced a performance regression. We can now make an informed decision on whether we want to keep the change or not.
Now that we understand how a differential flame graph works and how useful it is, let's explore how to generate one.
Generating flame graphs manually is unreliable and time-consuming
The first thing to note is that manually generated flame graphs on a dev machine are not consistent.
Running the same script multiple times with the same input will result in different flame graphs. Indeed, other processes running on the machine will impact the execution time of the script and its different functions. This make it hard to spot performance regressions with confidence.
The second thing to note is that generating flame graphs manually is tedious.
The first tool to generate flame graphs is the eponym FlameGraph by Brendan Gregg written in Perl. Since then, many other tools have been created in and for other languages. The general steps are the same:
- Run your script with a profiler and output the profile in a file
- Run the tool on the profile to generate a flame graph svg
- Open the generated svg in your browser and explore the data
This is already a quite heavy process: you have to create a script to isolate the part of your program you want to generate a flame graph for, then run a bunch of commands and finally open a file in your browser.
This is why we decided to automate the generation of flame graphs in your CI pipeline with CodSpeed, and find a way to make sure that the flame graphs are consistent.
Automating flame graphs with CodSpeed
Since we already had wrappers of benchmarking libraries in different languages, we decided to augment them with profiling capabilities.
Steps to follow to get flame graphs in your CI pipeline
Write benchmarks with one of our wrappers in Rust, Node.js, or Python.
For example, in Python, use our pytest extension pytest-codspeed (which API
is compatible with pytest-benchmark) and add a test marked as a benchmark:
import pytest
from parse_pr import parse_pr

@pytest.mark.benchmark
def test_parse_pr():
    parse_pr(body=very_long_body_string, pr_number=126, title="Refactor some code")
Run the benchmarks in the @codspeed/action GitHub Action:
- name: Run benchmarks
  uses: CodSpeedHQ/action@v3
  with:
    run: pytest tests/ --codspeed
The action will run the benchmarks on a "virtualized" CPU with Valgrind. Instead of measuring the execution time, it measures the number of CPU cycles and memory accesses. Each benchmark is only ran once and it is enough to get consistent data.
This data is then sent to CodSpeed's servers and flame graphs are generated. A comment is added to the GitHub Pull Request, with a link to the CodSpeed app, where you can browse the benchmarks and their flame graphs.
And voilà! You now have flame graphs in your CI pipeline, with the benefits of consistency and automation. Moreover, now that are using CodSpeed, performance regressions will automatically be detected and reported in your pull requests 🎉
Head out to our documentation to view integrations for the different languages.
Going further
Flame graphs are not only useful for spotting performance regressions but they can also be used to understand the performance impact of a change. Being an improvement or new calls to a function.
If you enjoyed this article, you can follow us on Twitter to get notified when we publish new articles.
Resources
- CPU Simulation in the CodSpeed documentation
- pytest-codspeed, plugin for pytest
- @codspeed/action, GitHub Action to run benchmarks and generate flame graphs
- Flame Graphs by Brendan Gregg
- Differential Flame Graphs by Brendan Gregg
- Linking a pull request to an issue
- Valgrind
- pytest-benchmark