Why does Continuous Performance analysis matter?
Performance is the cornerstone of many problems in software development. Application reactivity, infrastructure costs, energy consumption, and carbon footprint all depend on the performance of the underlying software. By performance, we often mean execution speed but more generally, it refers to the efficiency or throughput of a system.
Today, most of the performance monitoring is done through Application Performance Monitoring solutions(often referred to as APM), provided by companies such as Datadog, Sentry, Blackfire, and many others. These platforms bring several interesting insights about the production environment's health: client-side UX monitoring, endpoint latency checks, and even continuous production profiling.
However, these solutions are monitoring tools; they are built to check if everything is okay in production, and not really to run experiments. They need real users serving as guinea pigs to experience poor performance to be able to report anomalies.

So as a developer, to understand the performance impact of my changes, I need to wait for end users to try out my changes in production!? Then, if something is wrong, maybe I’ll try to improve it, someday…
In an ideal world, performance checks should be included way earlier in the development lifecycle; just as an additional testing flavor, nurturing continuous improvement.

Performance feedback in an ideal Software Development Life-Cycle
This much shorter feedback loop would provide visibility with consistent metrics to the teams while they are building and not once everything is already shipped in production environments. Besides, guesstimating performance is hard and often plain wrong. Accurate performance reports help in those cases and can serve as an educational tool for software developers.
Building a consistent performance metric
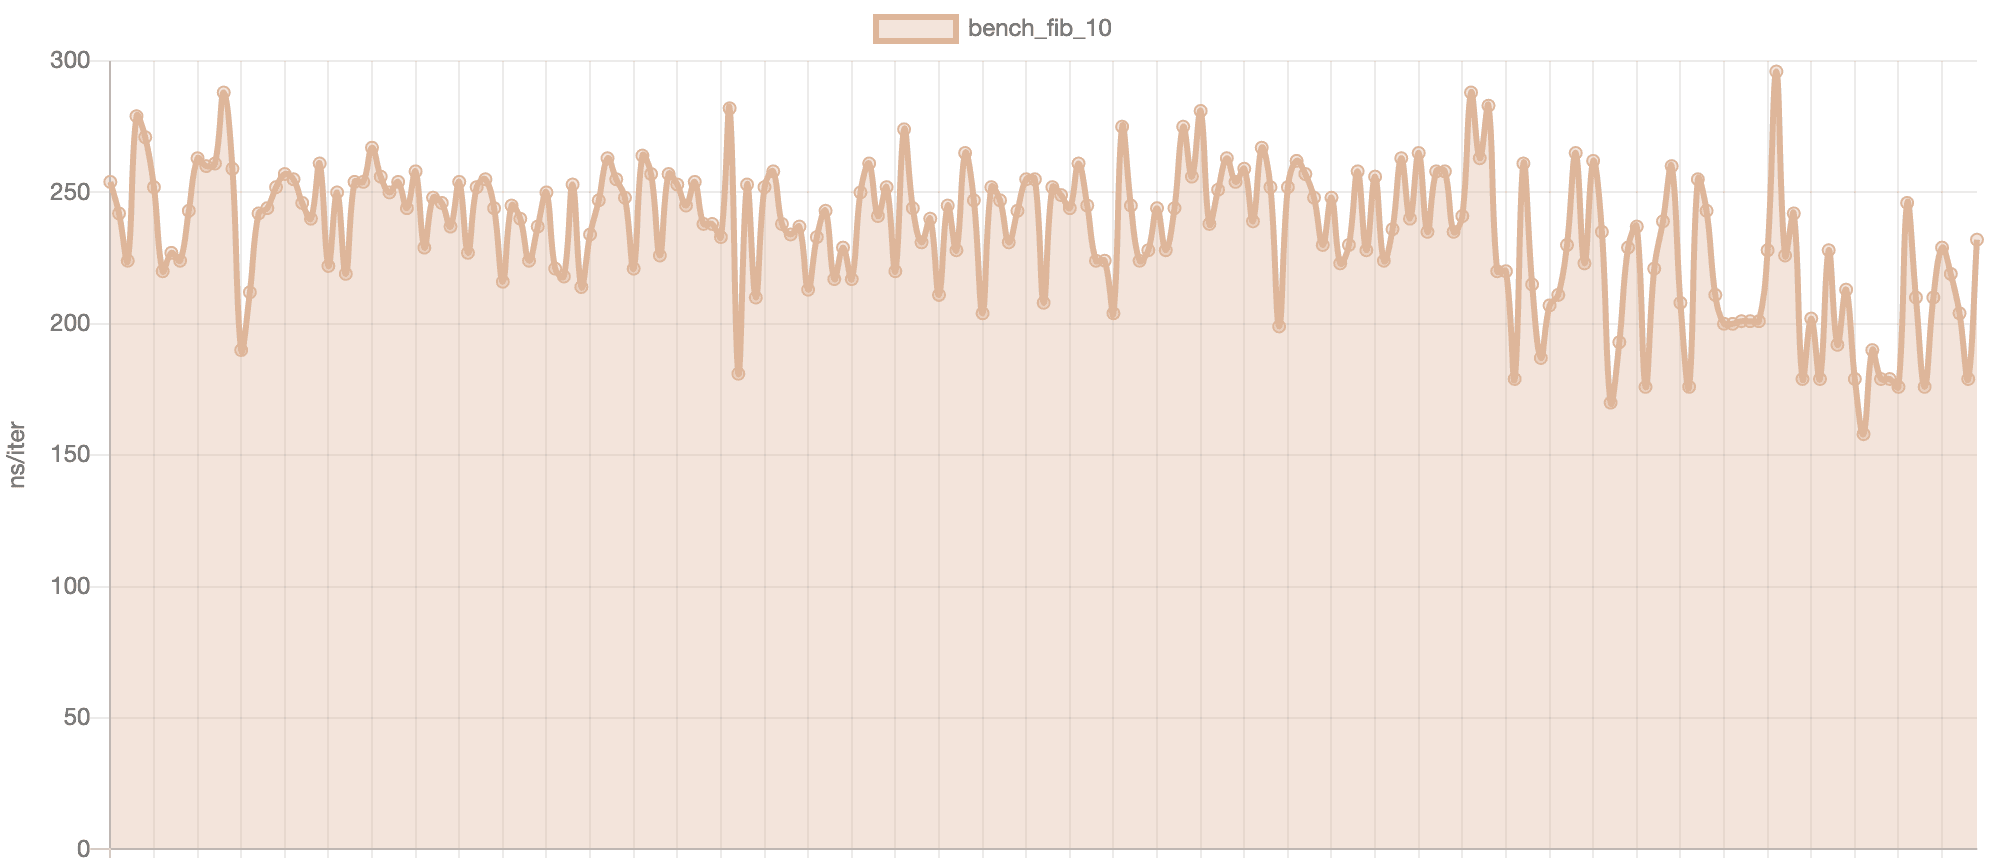
Measuring software performance in various environments to gather reproducible results is hard. The most basic metric we can think of is to measure the execution time but just changing the hardware will produce completely different data points. Running a program on a toaster will be significantly slower than running it on the latest generations of cloud instances. Joking aside, merely using the same machine at different times will produce different results because other unpredictable background tasks are eating up the CPU time.
One obvious solution to bring consistency in the results is to run the program in a controlled cloud environment where background running processes are very limited. Despite a significant improvement in the quality of the results, this doesn’t give repeatable measurements either because of the noisy neighbor issue. Basically, physical cloud machines are shared among customers by splitting them into multiple Virtual Machines. At a software level, those are perfectly isolated but in the end, they still share some common hardware and isolation can’t be perfect(eg. memory, high-level CPU caches, network interfaces). Since it’s not possible to predict the workload running along a measurement task, finding the “truth” in this noise becomes a statistical challenge, and building an extremely accurate metric is nearly impossible.

Time measurement for a Fibonacci sequence computation(Python runs from GitHub Action)
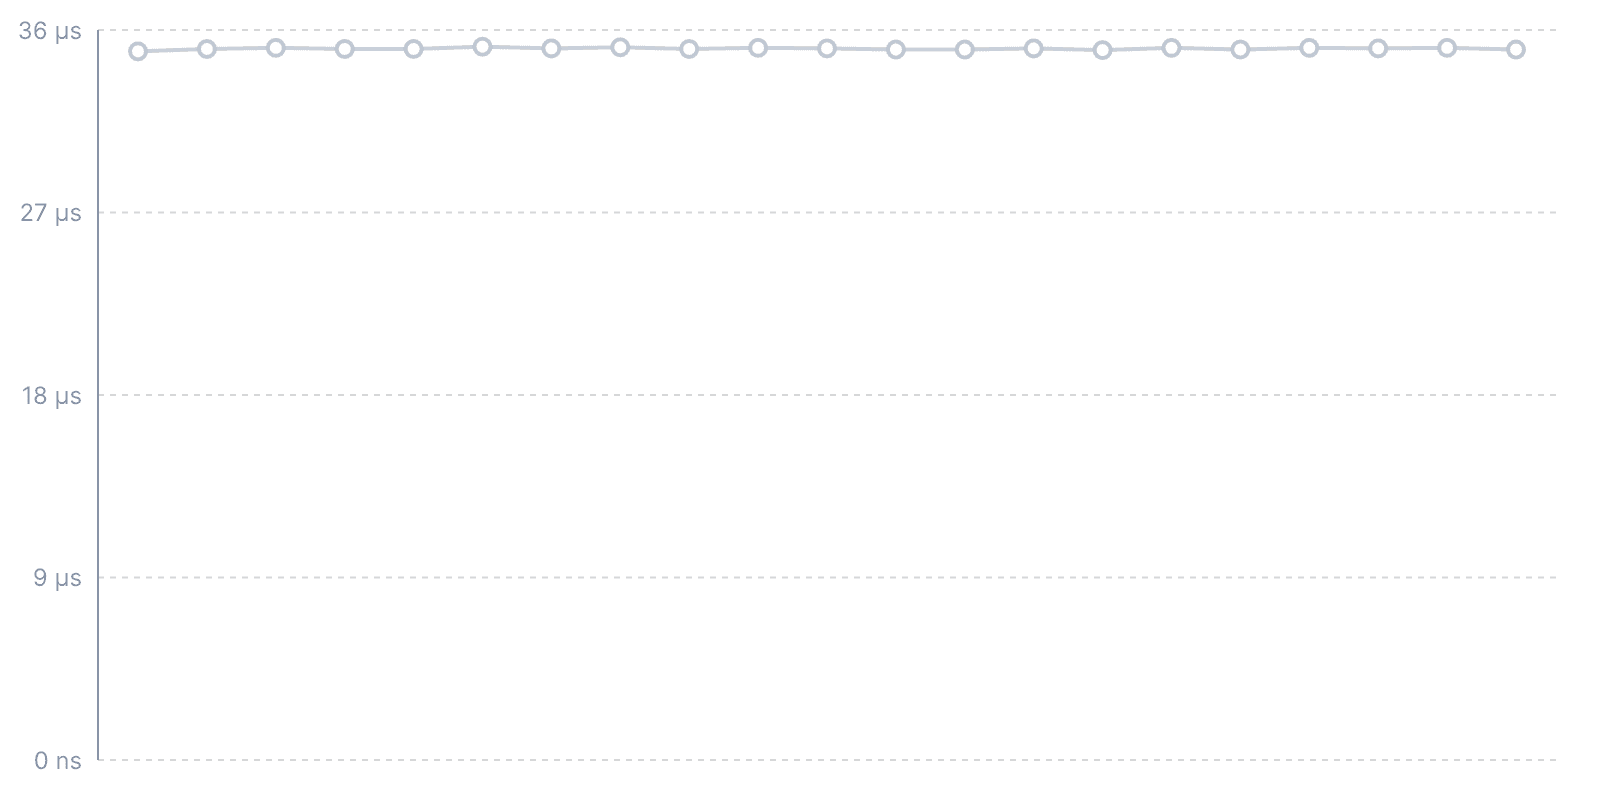
When it comes to consistency, working with execution time measurement seems doomed to failure. So what if we instead decided to dissect exactly what a virtual machine does to run our program? In this case, running the same measurement again and again on various machines produces the exact same results since the hosted virtual machine always starts with a predefined state and emulates the same hardware. We don’t mind the noisy neighbor issue either because whatever is running along our measurement doesn’t change the instructions executed to run our program in its sandboxed environment. Furthermore, based on those micro execution steps, it is possible to aggregate a time equivalent metric that will be consistent, accurate (detect less than 1% performance changes), and hardware agnostic: this is how CodSpeed works!

CodSpeed Measurement for a Fibonacci sequence computation(Python runs from GitHub Action)
Shifting left with CodSpeed
CodSpeed brings this consistent measurement to the Continuous Integration environments, enabling performance checks to be included in the software development lifecycle as early as possible.
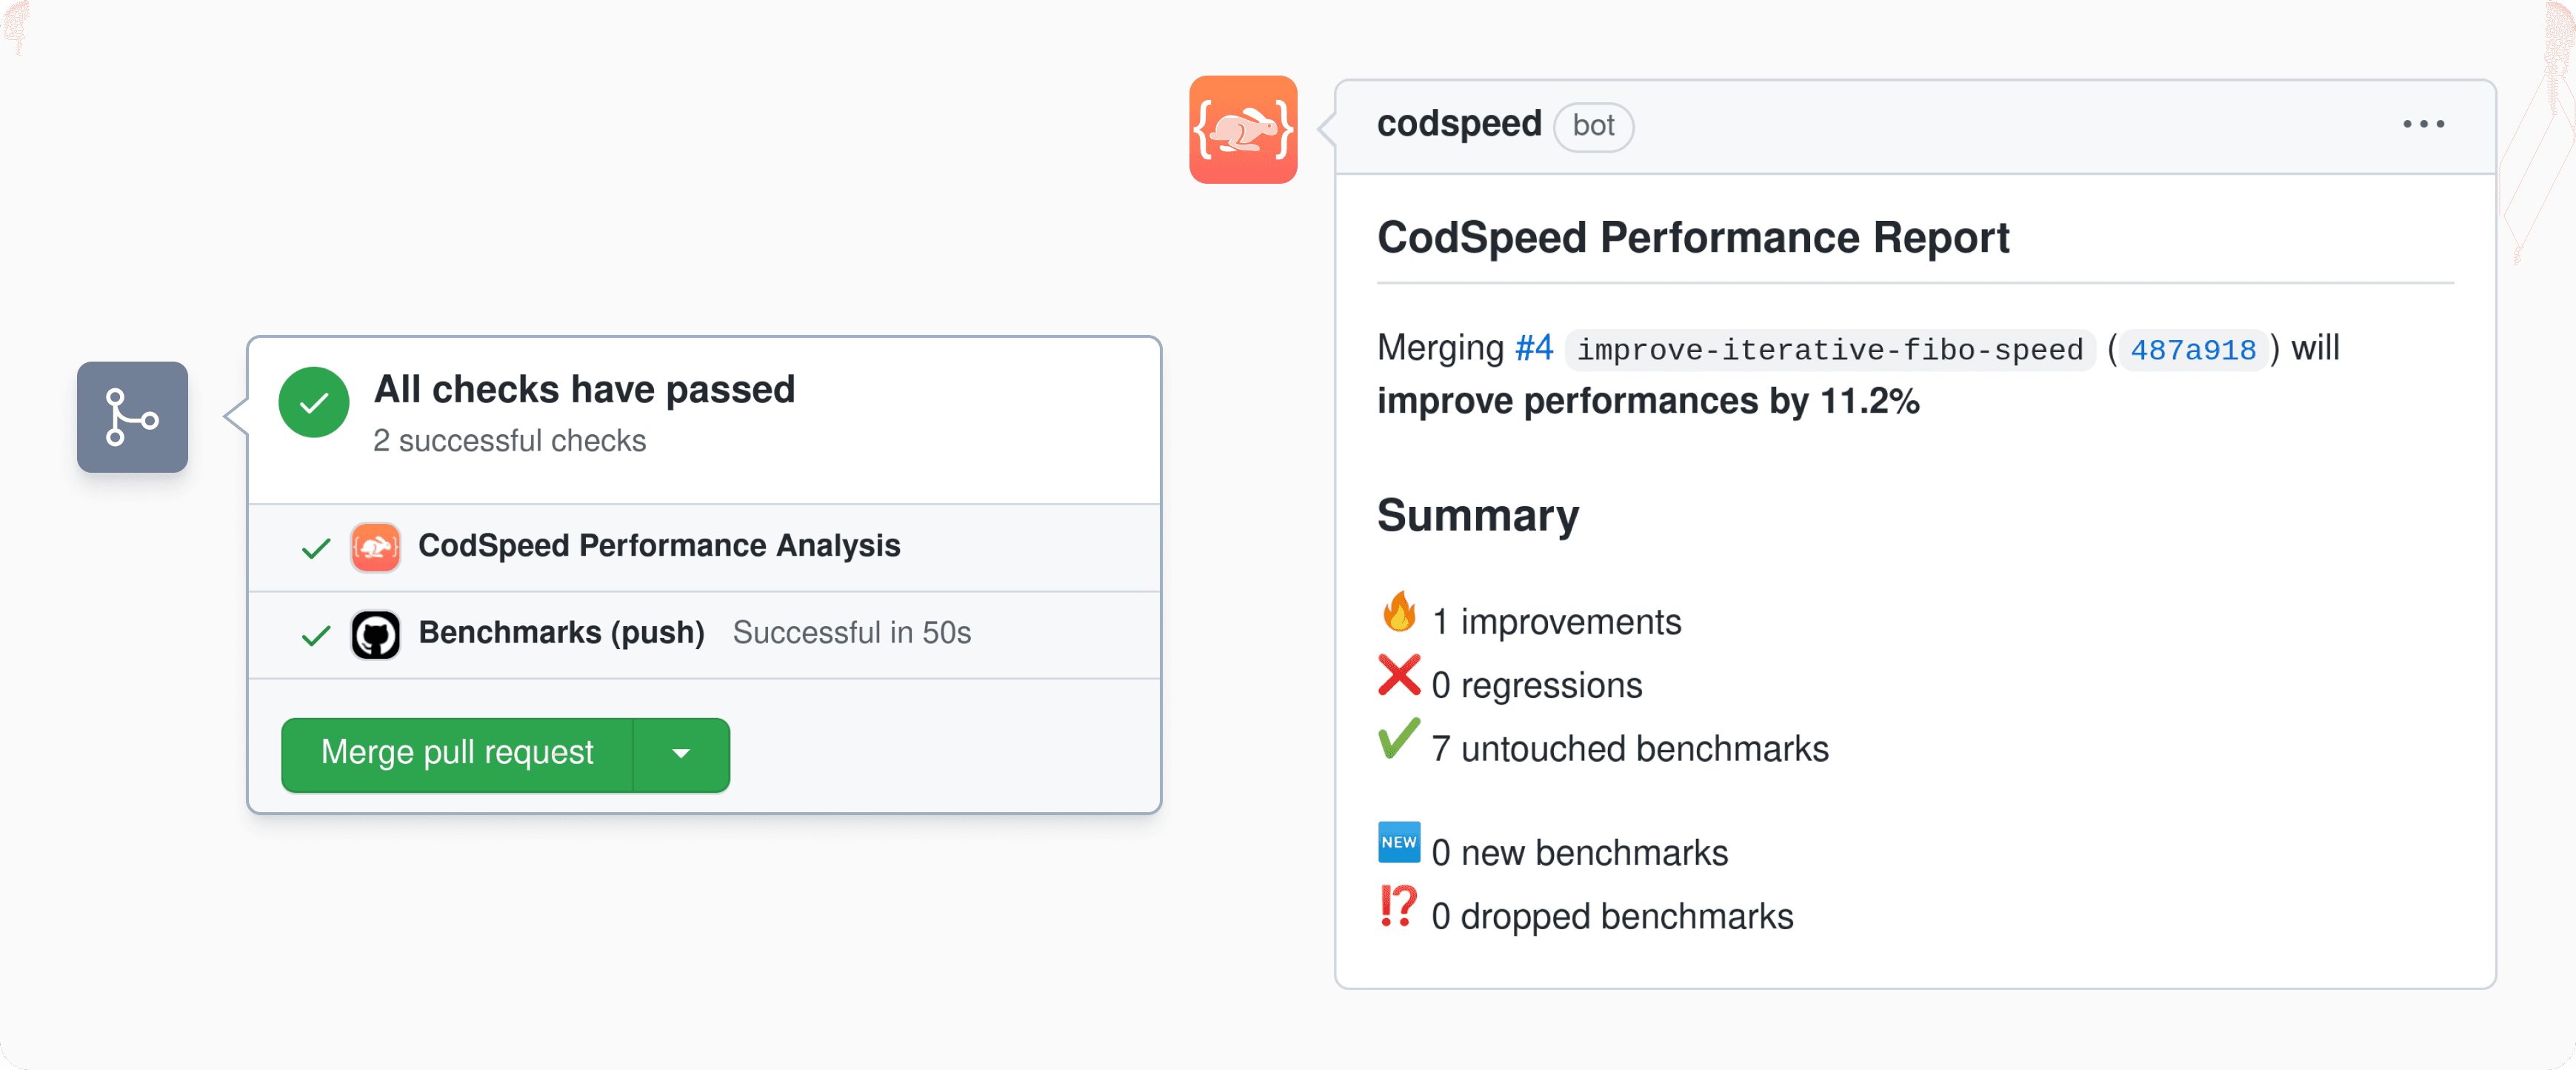
On every new feature, the performance is measured and reported directly in the repository provider as a Pull Request comment. Optionally, status checks can also be enabled to enforce performance requirements to be satisfied before merging the new delivery.

Furthermore, there is a whole platform available. Breaking down the performance per branches, commits, or benchmarks and giving you an overview of the upcoming performance changes. We will give you more details about this in a future blog post!
But the beta is already opened! 🎉
Here are some of the open-source repositories already using CodSpeed:
pydantic-core: The core validation logic for pydantic, a Python data parsing and validation library.pathfinding: A pathfinding library for Rust.swarmion: A set of tools to build and deploy type-safe serverless microservices with Typescript.
If you want to learn more, check out the product and follow us on Twitter to stay updated!
